
Imports of goods and services by country, 2025
| Rank | Country | Imports | Share of world | % of GDP |
|---|---|---|---|---|
 World |
$33.7T | 28.5% | ||
| 1 |  United States |
$4.36T | 12.9% | 14.2% |
| 2 |  China |
$3.29T | 9.76% | 16.9% |
| 3 |  Germany |
$1.92T | 5.7% | 38.1% |
| 4 |  United Kingdom |
$1.28T | 3.78% | 31.9% |
| 5 |  France |
$1.14T | 3.37% | 33.8% |
| 6 |  Japan |
$998B | 2.96% | 22.5% |
| 7 |  India |
$950B | 2.82% | 24.0% |
| 8 |  Netherlands |
$926B | 2.74% | 69.5% |
| 9 |  Singapore |
$860B | 2.55% | 142.5% |
| 10 |  Italy |
$773B | 2.29% | 30.3% |
| 11 |  South Korea |
$760B | 2.25% | 40.6% |
| 12 |  Canada |
$747B | 2.21% | 32.2% |
| 13 |  Mexico |
$738B | 2.19% | 40.3% |
| 14 |  Switzerland |
$721B | 2.14% | 69.1% |
| 15 |  Ireland |
$721B | 2.14% | 99.9% |
| 16 |  Spain |
$626B | 1.85% | 32.8% |
| 17 |  Belgium |
$562B | 1.67% | 77.5% |
| 18 |  Taiwan |
$503B | 1.49% | 54.5% |
| 19 |  Poland |
$488B | 1.45% | 47.1% |
| 20 |  UAE |
$482B (2023) | 1.59% | 92.2% |
| 21 |  Vietnam |
$474B | 1.41% | 92.1% |
| 22 |  Australia |
$407B | 1.21% | 22.7% |
| 23 |  Turkey |
$401B | 1.19% | 25.1% |
| 24 |  Brazil |
$398B | 1.18% | 17.5% |
| 25 |  Russia |
$397B | 1.18% | 15.5% |
| 26 |  Thailand |
$388B | 1.15% | 67.3% |
| 27 |  Saudi Arabia |
$360B | 1.07% | 28.2% |
| 28 |  Sweden |
$342B | 1.01% | 51.1% |
| 29 |  Malaysia |
$309B | 0.92% | 65.4% |
| 30 |  Austria |
$303B | 0.9% | 52.3% |
| 31 |  Indonesia |
$297B | 0.88% | 20.5% |
| 32 |  Denmark |
$273B | 0.81% | 59.1% |
| 33 |  Czech Republic |
$239B | 0.71% | 61.1% |
| 34 |  Philippines |
$196B | 0.58% | 40.2% |
| 35 |  Norway |
$179B | 0.53% | 33.7% |
| 36 |  Romania |
$175B | 0.52% | 40.7% |
| 37 |  Hungary |
$168B | 0.5% | 68.1% |
| 38 |  Luxembourg |
$161B | 0.48% | 159.4% |
| 39 |  Israel |
$155B | 0.46% | 25.4% |
| 40 |  Portugal |
$148B | 0.44% | 42.7% |
| 41 |  Slovakia |
$132B | 0.39% | 85.2% |
| 42 |  Finland |
$130B | 0.39% | 41.1% |
| 43 |  South Africa |
$126B | 0.37% | 29.5% |
| 44 |  Iran |
$125B | 0.37% | 34.5% |
| 45 |  Greece |
$123B | 0.37% | 44.0% |
| 46 |  Egypt |
$115B | 0.34% | 31.5% |
| 47 |  Ukraine |
$111B | 0.33% | 51.8% |
| 48 |  Chile |
$109B | 0.32% | 30.4% |
| 49 |  Argentina |
$101B | 0.3% | 14.8% |
| 50 |  Iraq |
$98.3B | 0.29% | 38.7% |
| 51 |  Morocco |
$93.3B | 0.28% | 51.1% |
| 52 |  Colombia |
$93.2B | 0.28% | 20.4% |
| 53 |  Kazakhstan |
$80.3B | 0.24% | 26.2% |
| 54 |  Bangladesh |
$76.8B | 0.23% | 16.8% |
| 55 |  Peru |
$73.2B | 0.22% | 21.8% |
| 56 |  Pakistan |
$70.1B | 0.21% | 17.2% |
| 57 |  New Zealand |
$68.4B | 0.2% | 25.9% |
| 58 |  Bulgaria |
$67.7B | 0.2% | 51.8% |
| 59 |  Kuwait |
$67.1B | 0.2% | 42.7% |
| 60 |  Lithuania |
$65.8B | 0.2% | 69.1% |
| 61 |  Qatar |
$65.6B | 0.19% | 30.5% |
| 62 |  Algeria |
$63.6B | 0.19% | 22.1% |
| 63 |  Serbia |
$58.6B | 0.17% | 58.6% |
| 64 |  Slovenia |
$58.4B | 0.17% | 73.3% |
| 65 |  Croatia |
$55.7B | 0.17% | 53.0% |
| 66 |  Belarus |
$53.3B | 0.16% | 57.0% |
| 67 |  Oman |
$53.2B | 0.16% | 48.5% |
| 68 |  Uzbekistan |
$52.0B | 0.15% | 35.4% |
| 69 |  DR Congo |
$40.0B | 0.12% | 43.9% |
| 70 |  Guatemala |
$38.2B | 0.11% | 31.0% |
| 71 |  Cyprus |
$37.9B | 0.11% | 91.9% |
| 72 |  Estonia |
$36.4B | 0.11% | 77.4% |
| 73 |  Ecuador |
$36.4B | 0.11% | 27.9% |
| 74 |  Dominican Republic |
$35.5B | 0.11% | 27.9% |
| 75 |  Bahrain |
$34.6B | 0.1% | 70.7% |
| 76 |  Cambodia |
$34.6B | 0.1% | 67.4% |
| 77 |  Panama |
$34.0B (2024) | 0.11% | 39.3% |
| 78 |  Costa Rica |
$33.6B | 0.1% | 32.6% |
| 79 |  Jordan |
$33.5B (2024) | 0.11% | 57.1% |
| 80 |  Latvia |
$32.6B | 0.1% | 67.2% |
| 81 |  Libya |
$31.7B | 0.09% | 65.9% |
| 82 |  Tunisia |
$31.5B | 0.09% | 54.8% |
| 83 |  Kenya |
$29.6B | 0.09% | 21.8% |
| 84 |  Ghana |
$28.2B (2024) | 0.09% | 33.9% |
| 85 |  Azerbaijan |
$28.0B | 0.08% | 36.8% |
| 86 |  Malta |
$27.7B | 0.08% | 99.9% |
| 87 |  Ethiopia |
$25.5B | 0.08% | 20.2% |
| 88 |  Sri Lanka |
$24.9B | 0.07% | 22.8% |
| 89 |  Ivory Coast |
$24.7B | 0.07% | 24.8% |
| 90 |  Honduras |
$22.4B | 0.07% | 56.5% |
| 91 |  El Salvador |
$20.6B | 0.06% | 56.1% |
| 92 |  Georgia |
$20.3B | 0.06% | 53.2% |
| 93 |  Paraguay |
$19.4B | 0.06% | 39.3% |
| 94 |  Uruguay |
$19.3B | 0.06% | 22.6% |
| 95 |  Tanzania |
$18.0B | 0.05% | 20.0% |
| 96 |  Uganda |
$17.8B | 0.05% | 28.8% |
| 97 |  Guinea |
$17.6B | 0.05% | 62.3% |
| 98 |  Bosnia |
$17.6B | 0.05% | 54.1% |
| 99 |  Iceland |
$16.3B | 0.05% | 42.4% |
| 100 |  Mongolia |
$15.9B | 0.05% | 62.6% |
| 101 |  Armenia |
$15.7B | 0.05% | 53.6% |
| 102 |  Nepal |
$15.3B | 0.05% | 33.7% |
| 103 |  Lebanon |
$15.3B (2024) | 0.05% | 58.9% |
| 104 |  Kyrgyzstan |
$14.8B | 0.04% | 65.6% |
| 105 |  Senegal |
$14.3B | 0.04% | 38.6% |
| 106 |  Angola |
$14.3B | 0.04% | 11.7% |
| 107 |  North Macedonia |
$14.0B | 0.04% | 73.4% |
| 108 |  Bolivia |
$14.0B (2024) | 0.04% | 25.5% |
| 109 |  Albania |
$13.0B | 0.04% | 42.5% |
| 110 |  Somalia |
$12.8B | 0.04% | 98.8% |
| 111 |  Mozambique |
$12.4B | 0.04% | 55.7% |
| 112 |  Moldova |
$12.4B | 0.04% | 60.9% |
| 113 |  Nicaragua |
$12.2B | 0.04% | 54.9% |
| 114 |  Mauritius |
$12.1B | 0.04% | 74.9% |
| 115 |  Afghanistan |
$12.1B (2024) | 0.04% | 68.1% |
| 116 |  Cameroon |
$12.0B | 0.04% | 20.3% |
| 117 |  Guyana |
$11.0B (2023) | 0.04% | 64.8% |
| 118 |  Venezuela |
$10.1B | 0.03% | 10.1% |
| 119 |  Zimbabwe |
$9.74B (2024) | 0.03% | 23.4% |
| 120 |  Namibia |
$9.64B | 0.03% | 63.9% |
| 121 |  Palestine |
$9.19B | 0.03% | 53.5% |
| 122 |  Tajikistan |
$8.59B | 0.03% | 48.6% |
| 123 |  Burkina Faso |
$8.29B | 0.02% | 30.0% |
| 124 |  Cuba |
$8.07B (2020) | 0.04% | 7.5% |
| 125 |  Mali |
$8.03B | 0.02% | 26.7% |
| 126 |  Brunei |
$7.82B | 0.02% | 52.0% |
| 127 |  Botswana |
$7.48B | 0.02% | 37.5% |
| 128 |  Congo |
$7.12B | 0.02% | 43.6% |
| 129 |  Zambia |
$6.97B (2024) | 0.02% | 27.6% |
| 130 |  Turkmenistan |
$6.82B | 0.02% | 13.7% |
| 131 |  Syria |
$6.80B (2022) | 0.02% | 28.7% |
| 132 |  Bahamas |
$6.56B (2024) | 0.02% | 41.5% |
| 133 |  Madagascar |
$6.46B | 0.02% | 32.9% |
| 134 |  Mauritania |
$6.33B | 0.02% | 54.2% |
| 135 |  Gabon |
$6.30B | 0.02% | 29.4% |
| 136 |  Montenegro |
$6.07B | 0.02% | 65.7% |
| 137 |  Rwanda |
$5.75B | 0.02% | 35.1% |
| 138 |  Maldives |
$5.53B (2024) | 0.02% | 78.3% |
| 139 |  Suriname |
$5.50B | 0.02% | 121.6% |
| 140 |  Benin |
$4.93B | 0.01% | 20.1% |
| 141 |  Haiti |
$4.60B | 0.01% | 14.3% |
| 142 |  Djibouti |
$4.43B | 0.01% | 95.8% |
| 143 |  Malawi |
$4.29B | 0.01% | 28.8% |
| 144 |  Togo |
$4.05B (2024) | 0.01% | 38.1% |
| 145 |  Niger |
$3.93B | 0.01% | 18.1% |
| 146 |  Fiji |
$3.85B (2024) | 0.01% | 64.6% |
| 147 |  Equatorial Guinea |
$3.64B | 0.01% | 28.4% |
| 148 |  Chad |
$3.59B | 0.01% | 16.7% |
| 149 |  San Marino |
$3.14B (2024) | 0.01% | n/a |
| 150 |  Eswatini |
$2.93B | 0.009% | 56.8% |
| 151 |  Lesotho |
$2.69B | 0.008% | 104.5% |
| 152 |  Cayman Islands |
$2.59B (2020) | 0.01% | 45.8% |
| 153 |  Seychelles |
$2.21B | 0.007% | 92.7% |
| 154 |  Sierra Leone |
$2.11B | 0.006% | 28.2% |
| 155 |  Belize |
$1.73B | 0.005% | 52.1% |
| 156 |  Cape Verde |
$1.63B | 0.005% | 53.4% |
| 157 |  Bhutan |
$1.60B (2024) | 0.005% | 47.9% |
| 158 |  East Timor |
$1.58B (2024) | 0.005% | 84.9% |
| 159 |  Gambia |
$1.28B | 0.004% | 49.4% |
| 160 |  Antigua |
$1.18B (2022) | 0.004% | 63.3% |
| 161 |  Solomon Islands |
$1.12B (2024) | 0.004% | 70.8% |
| 162 |  CAR |
$1.03B | 0.003% | 33.6% |
| 163 |  Burundi |
$836M (2023) | 0.003% | 24.4% |
| 164 |  Sudan |
$769M | 0.002% | 1.3% |
| 165 |  Guinea-Bissau |
$683M | 0.002% | 27.0% |
| 166 |  Vanuatu |
$623M (2024) | 0.002% | 48.0% |
| 167 |  Comoros |
$573M | 0.002% | 31.6% |
| 168 |  Samoa |
$554M | 0.002% | 43.0% |
| 169 |  Tonga |
$435M | 0.001% | 64.0% |
| 170 |  Kiribati |
$372M | 0.001% | 106.6% |
| 171 |  Sao Tome |
$327M | <0.001% | 33.3% |
| 172 |  Marshall Islands |
$246M | <0.001% | 79.9% |
| 173 |  Palau |
$235M (2024) | <0.001% | 73.1% |
| 174 |  Nauru |
$183M | <0.001% | 103.7% |
| Not ranked: latest data before 2020 | ||||
 Yemen |
$10.2B (2018) | 0.04% | 47.3% | |
 Jamaica |
$8.87B (2019) | 0.04% | 52.1% | |
 Laos |
$6.66B (2016) | 0.03% | 41.9% | |
 South Sudan |
$3.47B (2015) | 0.02% | 28.9% | |
 Curacao |
$2.80B (2018) | 0.01% | 92.0% | |
 Papua New Guinea |
$2.31B (2004) | 0.02% | 58.9% | |
 Eritrea |
$604M (2011) | 0.003% | 29.2% | |
The list ranks 174 countries by their latest imports of goods and services, from the United States ($4.36 trillion) to Nauru ($183 million). The world's imports of goods and services were $33.7 trillion in 2025. Half of the countries imported less than $25.2 billion.
Imports are the goods and services a country buys from other countries in a year: goods such as machinery, fuels, food or clothing, and services such as transport, its residents' travel abroad, insurance and software. The figures are in current US dollars, so they also change with prices and exchange rates. The categories and the origins of goods on the country pages come from customs records.
Map of imports of goods and services by country
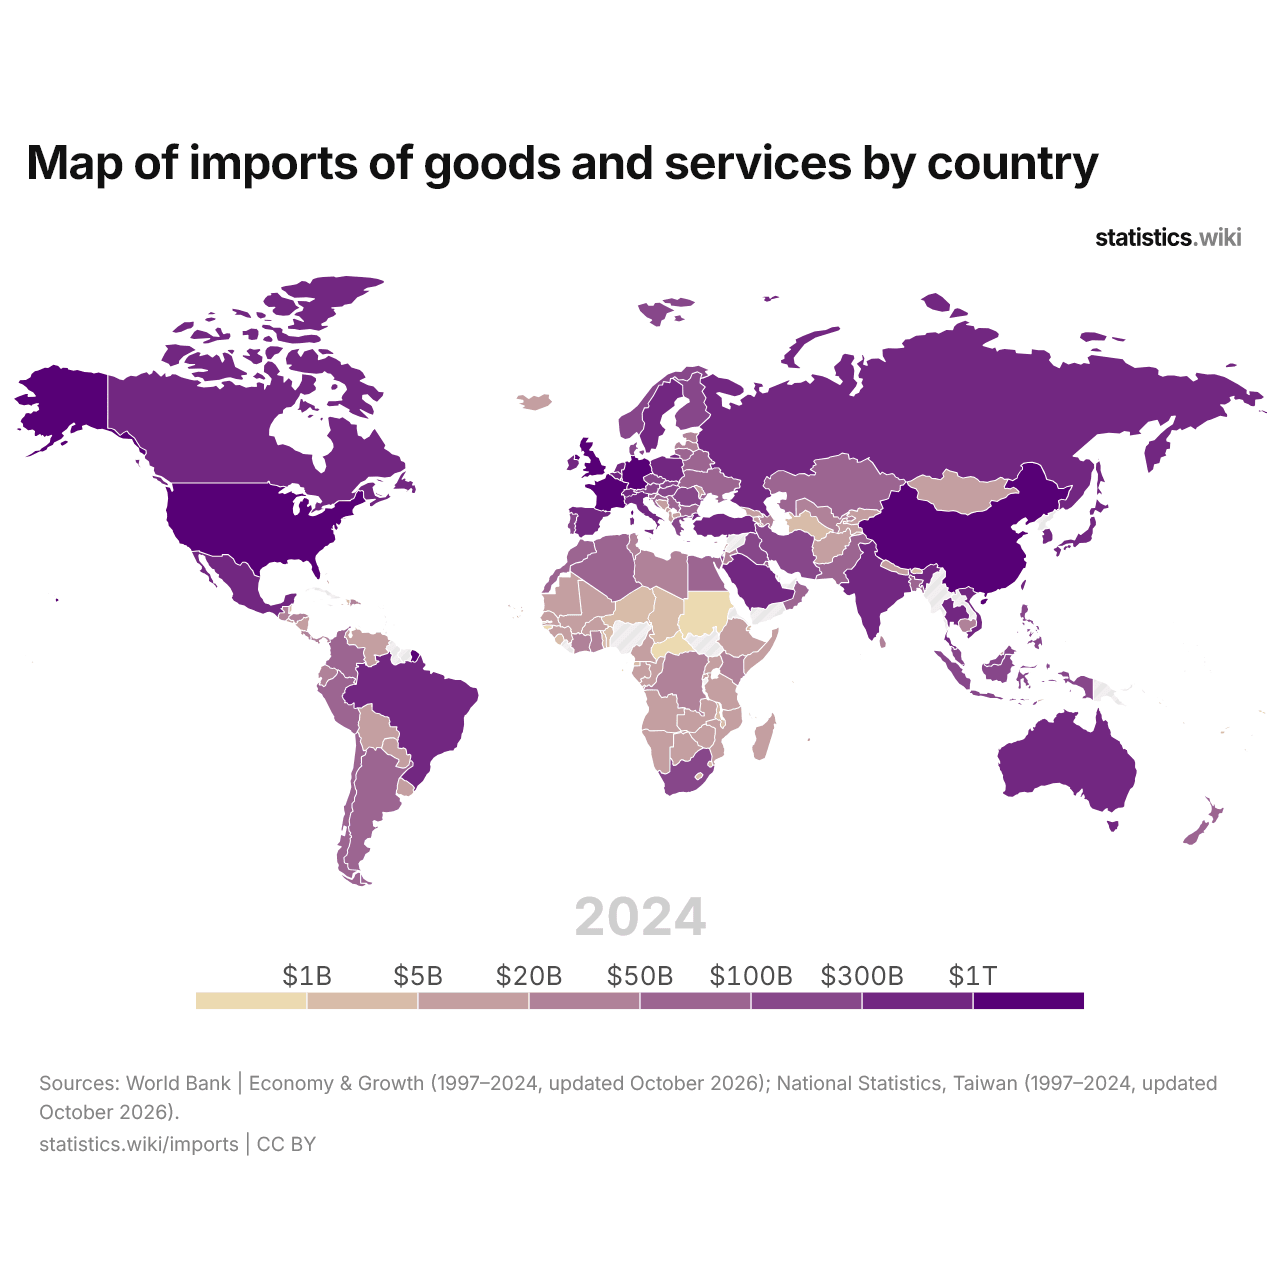
Imports of goods and services are more than $100 billion in 45 countries and less than $1 billion in 13 (2024); in 1997, the numbers were 16 and 36.
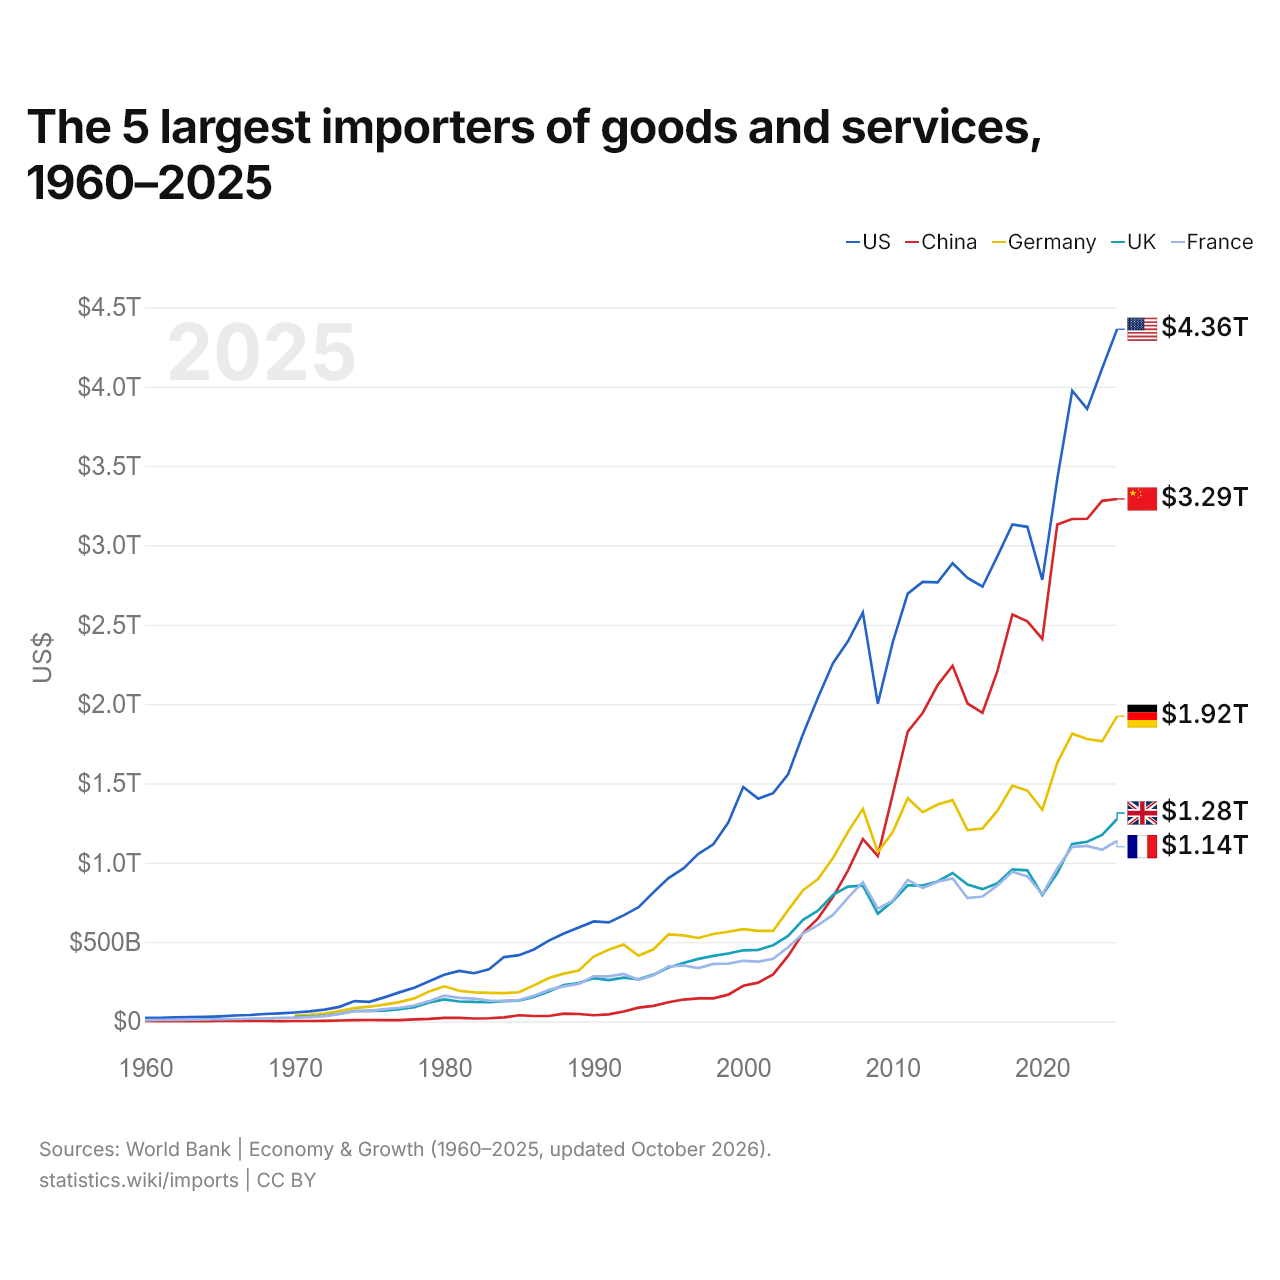
The 5 largest importers of goods and services, 1960–2025
| Year | US$ | ||||
|---|---|---|---|---|---|
| United States | China | Germany | United Kingdom | France | |
| 2025 | $4,361,777,000,000 | $3,292,280,901,123 | $1,923,292,318,697 | $1,275,239,250,328 | $1,137,799,795,607 |
| 2024 | $4,113,828,000,000 | $3,280,170,243,047 | $1,764,438,191,611 | $1,174,549,941,083 | $1,081,453,951,069 |
| 2023 | $3,859,856,000,000 | $3,167,502,597,276 | $1,779,045,873,341 | $1,131,603,446,868 | $1,105,442,442,028 |
| 2022 | $3,974,319,000,000 | $3,166,016,135,468 | $1,813,049,636,002 | $1,117,793,765,633 | $1,099,664,152,806 |
| 2021 | $3,417,930,000,000 | $3,132,116,155,606 | $1,628,851,031,194 | $934,375,952,194 | $964,103,785,592 |
| 2020 | $2,782,391,000,000 | $2,409,650,385,964 | $1,332,733,837,256 | $795,714,534,395 | $801,836,174,373 |
| 2019 | $3,116,681,000,000 | $2,521,036,548,137 | $1,454,588,084,839 | $951,880,342,949 | $913,209,092,424 |
| 2018 | $3,131,166,000,000 | $2,564,121,910,995 | $1,485,437,649,158 | $957,619,509,260 | $942,517,078,079 |
| 2017 | $2,931,589,000,000 | $2,208,518,918,632 | $1,327,357,307,454 | $869,550,502,969 | $856,501,561,408 |
| 2016 | $2,738,830,000,000 | $1,944,490,534,275 | $1,215,609,853,746 | $833,100,578,280 | $786,690,099,965 |
| 2015 | $2,794,942,000,000 | $2,003,260,696,069 | $1,204,648,073,432 | $861,463,440,127 | $776,983,112,153 |
| 2014 | $2,887,445,000,000 | $2,241,276,198,979 | $1,393,837,781,387 | $934,525,774,097 | $900,072,034,980 |
| 2013 | $2,766,375,000,000 | $2,119,392,421,428 | $1,366,940,257,620 | $881,359,614,350 | $879,403,265,970 |
| 2012 | $2,769,317,000,000 | $1,943,205,232,867 | $1,317,969,624,115 | $855,876,434,983 | $839,869,181,340 |
| 2011 | $2,695,480,000,000 | $1,825,413,639,206 | $1,406,669,611,897 | $857,771,146,098 | $891,743,744,380 |
| 2010 | $2,389,555,000,000 | $1,432,422,435,977 | $1,192,329,684,250 | $756,632,614,065 | $761,083,995,458 |
| 2009 | $2,001,927,000,000 | $1,042,533,759,653 | $1,067,378,170,076 | $678,917,276,834 | $710,610,400,819 |
| 2008 | $2,576,151,000,000 | $1,149,036,249,786 | $1,339,125,795,808 | $855,805,147,059 | $877,476,980,121 |
| 2007 | $2,395,228,000,000 | $950,020,767,157 | $1,193,186,147,673 | $848,867,547,019 | $777,995,714,258 |
| 2006 | $2,256,623,000,000 | $782,812,463,260 | $1,029,339,915,529 | $796,610,855,566 | $670,822,254,333 |
| 2005 | $2,041,482,000,000 | $648,712,207,880 | $896,950,519,583 | $697,472,727,273 | $606,331,902,820 |
| 2004 | $1,810,504,000,000 | $556,182,551,585 | $826,352,918,672 | $639,128,524,350 | $553,011,604,110 |
| 2003 | $1,557,120,000,000 | $412,137,124,715 | $700,765,174,545 | $537,968,979,592 | $467,250,572,393 |
| 2002 | $1,437,724,000,000 | $295,619,639,659 | $570,622,539,400 | $479,947,541,966 | $394,028,136,002 |
| 2001 | $1,403,559,000,000 | $243,973,790,218 | $570,228,511,977 | $450,228,875,774 | $376,341,467,532 |
| 2000 | $1,477,184,000,000 | $224,306,238,158 | $580,553,292,712 | $447,681,948,858 | $381,449,581,352 |
| 1999 | $1,252,460,000,000 | $168,058,444,268 | $564,301,984,739 | $427,731,758,615 | $363,754,404,232 |
| 1998 | $1,115,690,000,000 | $144,913,704,696 | $550,595,754,140 | $412,207,684,664 | $361,782,299,311 |
| 1997 | $1,055,774,000,000 | $144,623,820,000 | $525,385,743,289 | $393,672,233,137 | $335,869,521,241 |
| 1996 | $963,966,000,000 | $137,261,877,000 | $541,957,369,379 | $367,588,143,526 | $351,587,382,998 |
| 1995 | $902,572,000,000 | $119,900,826,000 | $547,772,621,810 | $339,072,116,143 | $346,832,698,121 |
| 1994 | $813,424,000,000 | $97,250,445,198 | $453,912,257,442 | $294,340,260,178 | $291,034,380,907 |
| 1993 | $719,973,000,000 | $86,072,328,750 | $413,095,942,269 | $264,458,431,314 | $261,684,618,948 |
| 1992 | $667,791,000,000 | $61,849,400,129 | $483,833,437,696 | $275,832,937,873 | $299,027,013,631 |
| 1991 | $623,544,000,000 | $43,941,659,170 | $451,492,044,785 | $259,644,733,686 | $283,762,818,277 |
| 1990 | $629,728,000,000 | $38,461,758,920 | $408,062,314,490 | $272,419,897,017 | $284,198,409,830 |
| 1989 | $591,030,000,000 | $46,118,793,490 | $320,659,348,799 | $241,323,782,723 | $235,996,092,947 |
| 1988 | $553,993,000,000 | $48,984,701,330 | $300,437,976,389 | $229,258,518,321 | $220,384,539,148 |
| 1987 | $508,713,000,000 | $33,781,853,910 | $272,758,220,892 | $188,351,657,134 | $198,155,407,618 |
| 1986 | $452,867,000,000 | $33,592,580,690 | $226,641,451,860 | $152,907,770,449 | $161,558,386,211 |
| 1985 | $417,229,000,000 | $38,302,403,274 | $182,999,144,300 | $130,952,876,027 | $133,894,510,147 |
| 1984 | $405,107,000,000 | $24,710,305,081 | $177,813,724,143 | $127,268,012,769 | $128,606,695,189 |
| 1983 | $328,638,000,000 | $19,385,304,449 | $179,485,369,590 | $121,326,941,034 | $130,312,075,049 |
| 1982 | $303,184,000,000 | $17,788,124,795 | $182,672,746,836 | $122,122,796,995 | $143,140,932,229 |
| 1981 | $317,758,000,000 | $22,219,750,000 | $192,540,531,372 | $125,119,803,055 | $148,003,379,602 |
| 1980 | $293,828,000,000 | $21,842,710,000 | $220,826,310,523 | $137,927,313,502 | $161,433,405,775 |
| 1979 | $252,674,000,000 | $15,535,283,000 | $188,647,315,121 | $118,503,699,704 | $127,256,552,575 |
| 1978 | $212,250,000,000 | $12,261,700,000 | $144,746,943,525 | $89,608,628,955 | $99,531,104,651 |
| 1977 | $182,443,000,000 | $8,060,398,000 | $120,869,841,658 | $76,156,548,055 | $85,644,958,545 |
| 1976 | $151,146,000,000 | $7,349,809,000 | $105,524,313,345 | $67,727,417,790 | $77,268,779,022 |
| 1975 | $122,730,000,000 | $8,355,050,000 | $92,240,550,918 | $65,493,940,265 | $66,145,785,529 |
| 1974 | $127,465,000,000 | $7,716,198,000 | $83,360,334,820 | $65,219,086,022 | $63,613,611,566 |
| 1973 | $91,159,000,000 | $5,257,791,000 | $65,139,754,848 | $47,681,185,693 | $45,888,332,351 |
| 1972 | $74,216,000,000 | $2,916,450,000 | $48,517,046,556 | $35,239,697,802 | $33,141,612,484 |
| 1971 | $62,342,000,000 | $2,233,127,000 | $40,715,115,151 | $30,409,471,891 | $26,488,930,981 |
| 1970 | $55,760,000,000 | $2,201,560,000 | $35,798,334,313 | $27,400,376,770 | $23,582,378,647 |
| 1969 | $50,439,790,647 | $1,731,190,000 | - | - | $21,479,310,052 |
| 1968 | $46,486,084,810 | $1,845,220,000 | - | - | $17,932,241,725 |
| 1967 | $39,860,199,662 | $1,919,860,000 | - | - | $16,105,495,991 |
| 1966 | $37,009,236,566 | $2,185,300,000 | - | - | $14,747,626,953 |
| 1965 | $31,461,196,297 | $1,916,420,000 | - | - | $12,990,103,310 |
| 1964 | $28,043,049,184 | $1,481,100,000 | - | - | $12,529,464,175 |
| 1963 | $26,080,864,402 | $1,210,670,000 | - | - | $10,693,152,241 |
| 1962 | $24,919,992,127 | $1,127,720,000 | - | - | $9,325,584,138 |
| 1961 | $22,659,754,237 | $1,408,090,000 | - | - | $8,539,959,909 |
| 1960 | $22,824,075,764 | $1,890,590,000 | - | - | $7,955,890,214 |
In 2025, the United States imported $4.36 trillion, China $3.29 trillion, Germany $1.92 trillion, the United Kingdom $1.28 trillion and France $1.14 trillion. The United States' imports have been the largest of the five every year since 1960. The most recent change in their order came in 2022, when the United Kingdom passed France.
The 10 largest importers each year
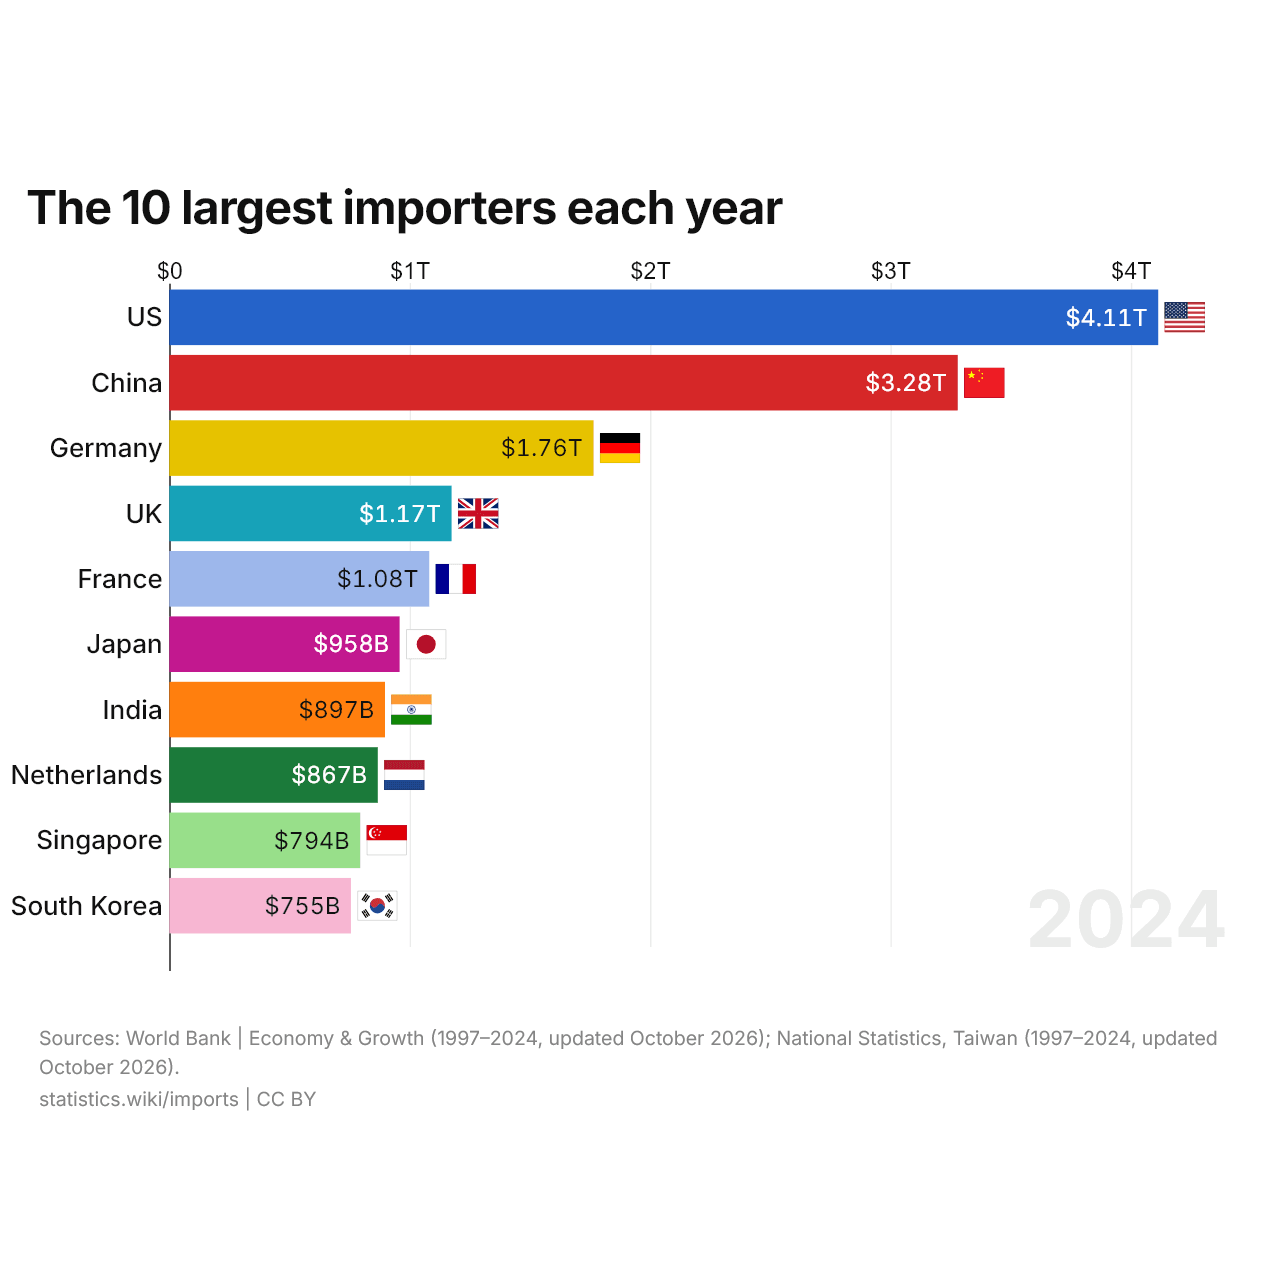
The ten largest importers accounted for 50% of the world's imports in 2024, compared with 55% in 1997. India moved up the most among them, from 29th in 1997 to 7th in 2024.
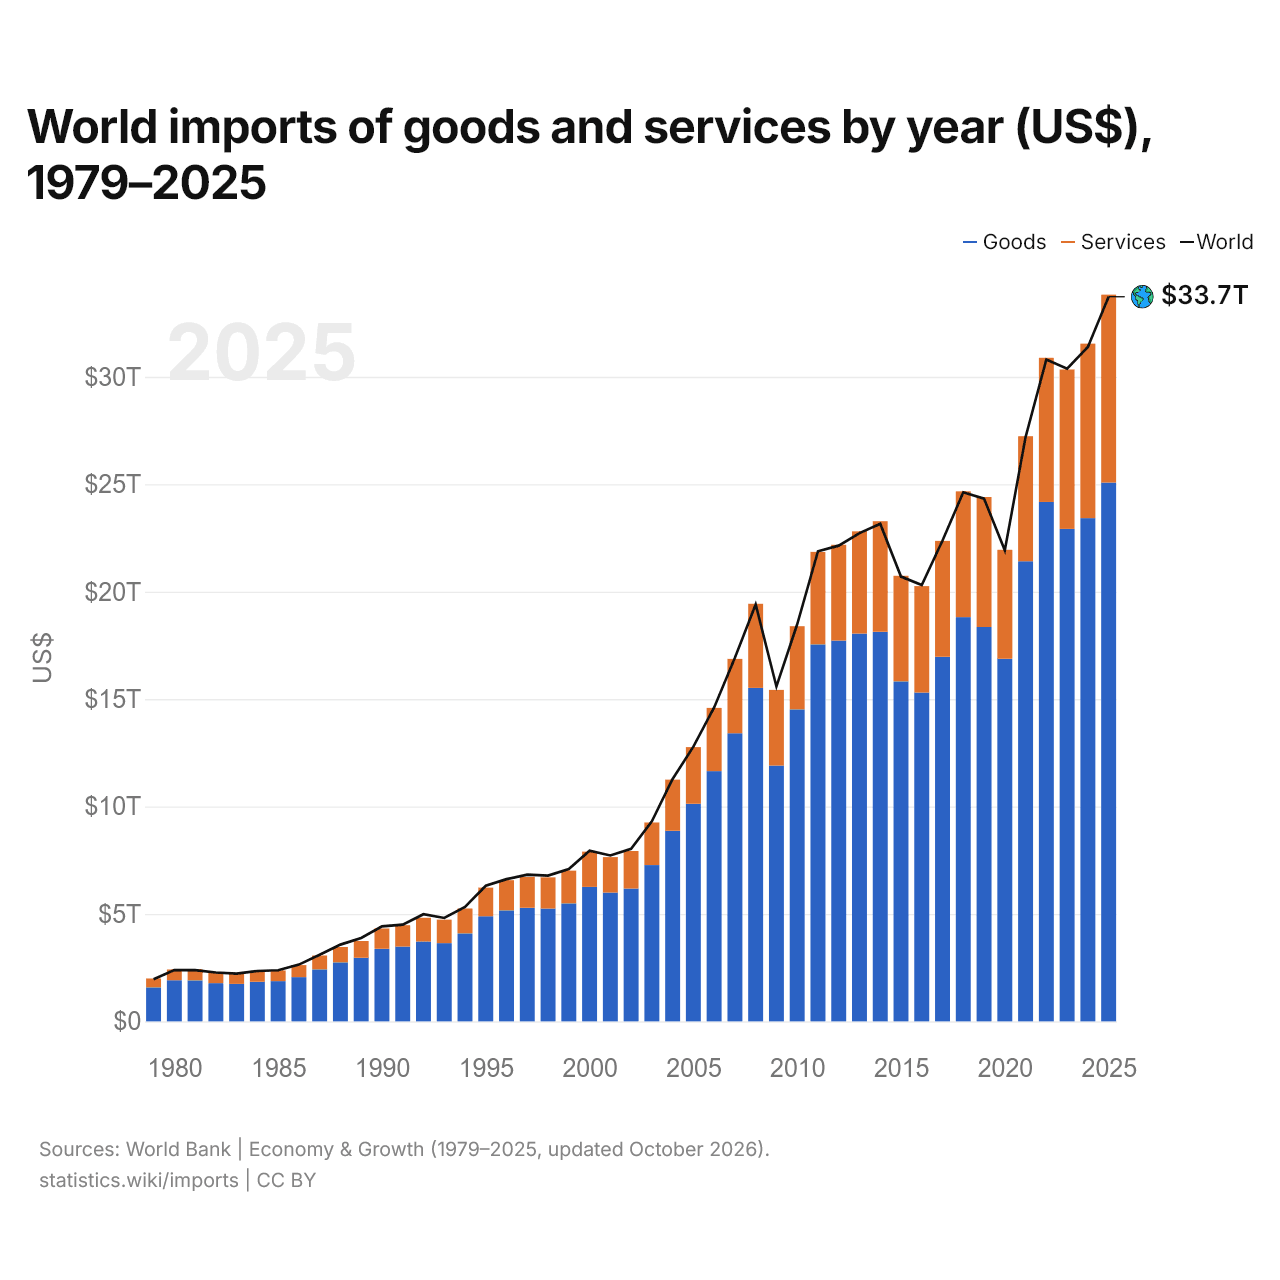
World imports of goods and services by year (US$), 1979–2025
| Year | US$ | ||
|---|---|---|---|
| Goods | Services | World | |
| 2025 | $25,077,566,262,876 | $8,747,058,302,539 | $33,728,843,548,701 |
| 2024 | $23,420,812,205,376 | $8,124,975,987,016 | $31,392,679,664,389 |
| 2023 | $22,922,169,693,426 | $7,421,124,995,929 | $30,377,560,788,067 |
| 2022 | $24,177,177,079,333 | $6,708,785,902,501 | $30,808,072,350,614 |
| 2021 | $21,414,556,251,019 | $5,819,755,273,687 | $27,196,401,272,251 |
| 2020 | $16,878,495,846,082 | $5,072,284,083,634 | $21,926,040,204,089 |
| 2019 | $18,355,746,986,689 | $6,050,956,548,155 | $24,329,732,406,068 |
| 2018 | $18,816,082,208,947 | $5,855,099,295,837 | $24,624,869,331,654 |
| 2017 | $16,968,658,412,335 | $5,396,499,285,806 | $22,381,731,654,106 |
| 2016 | $15,300,514,435,443 | $4,959,103,562,238 | $20,310,090,150,526 |
| 2015 | $15,825,650,396,254 | $4,916,768,115,501 | $20,701,252,913,668 |
| 2014 | $18,130,182,304,856 | $5,148,806,393,593 | $23,155,541,535,158 |
| 2013 | $18,048,671,684,053 | $4,761,205,731,444 | $22,726,015,303,740 |
| 2012 | $17,722,325,037,062 | $4,462,636,107,201 | $22,142,475,910,512 |
| 2011 | $17,544,216,492,954 | $4,308,817,036,445 | $21,879,610,652,162 |
| 2010 | $14,523,351,159,935 | $3,868,360,865,424 | $18,482,047,169,004 |
| 2009 | $11,908,160,882,506 | $3,518,377,957,482 | $15,584,280,389,048 |
| 2008 | $15,521,471,848,539 | $3,915,705,312,735 | $19,406,591,657,176 |
| 2007 | $13,408,089,706,578 | $3,464,979,980,890 | $16,920,369,649,483 |
| 2006 | $11,646,125,860,551 | $2,943,747,063,207 | $14,608,784,602,022 |
| 2005 | $10,127,008,544,834 | $2,637,694,231,083 | $12,785,487,493,402 |
| 2004 | $8,867,563,208,322 | $2,384,423,620,911 | $11,279,956,287,410 |
| 2003 | $7,274,334,228,602 | $1,984,153,108,596 | $9,311,821,838,703 |
| 2002 | $6,177,445,490,677 | $1,750,839,595,370 | $8,033,299,796,775 |
| 2001 | $5,990,251,245,806 | $1,655,035,466,559 | $7,721,296,985,134 |
| 2000 | $6,256,463,762,516 | $1,640,819,101,845 | $7,942,957,689,019 |
| 1999 | $5,490,100,105,149 | $1,528,379,726,212 | $7,091,237,749,662 |
| 1998 | $5,250,505,285,389 | $1,453,817,762,503 | $6,785,465,628,839 |
| 1997 | $5,285,376,411,725 | $1,447,009,882,172 | $6,828,842,165,075 |
| 1996 | $5,165,965,861,094 | $1,405,857,425,365 | $6,617,560,102,669 |
| 1995 | $4,892,063,587,940 | $1,333,936,141,878 | $6,311,334,827,324 |
| 1994 | $4,092,060,575,457 | $1,158,902,093,214 | $5,326,608,015,904 |
| 1993 | $3,641,443,990,436 | $1,091,426,208,467 | $4,810,989,773,327 |
| 1992 | $3,717,863,263,614 | $1,102,212,496,939 | $4,986,260,197,700 |
| 1991 | $3,478,299,635,262 | $996,972,900,838 | $4,502,176,619,000 |
| 1990 | $3,381,681,314,410 | $938,240,018,810 | $4,418,613,079,994 |
| 1989 | $2,962,572,781,614 | $777,718,840,169 | $3,880,436,522,019 |
| 1988 | $2,744,849,073,620 | $717,515,460,943 | $3,570,940,979,047 |
| 1987 | $2,416,642,547,048 | $645,464,163,476 | $3,097,610,852,103 |
| 1986 | $2,058,340,253,097 | $559,307,588,711 | $2,640,492,376,852 |
| 1985 | $1,870,236,631,439 | $498,846,177,113 | $2,376,458,618,670 |
| 1984 | $1,846,460,495,193 | $494,750,124,563 | $2,344,002,767,487 |
| 1983 | $1,742,628,237,167 | $487,296,227,531 | $2,223,198,245,460 |
| 1982 | $1,774,810,882,127 | $500,933,832,854 | $2,271,053,702,681 |
| 1981 | $1,904,603,388,865 | $515,749,442,137 | $2,385,596,157,956 |
| 1980 | $1,914,032,269,700 | $496,597,478,525 | $2,384,098,808,853 |
| 1979 | $1,580,751,331,392 | $414,205,396,533 | $1,959,613,667,580 |
World imports of goods and services were $33.7 trillion in 2025, compared with $1.96 trillion in 1979. They fell from the year before in 11 of the 46 years since 1979, most recently in 2023. Services made up 25.9% of the imports of goods and services in 2025, compared with 20.8% in 1979.
Compare the imports of any 2 countries
Sources:
- World Bank | Economy & Growth (1960–2025, updated October 2026)
- National Statistics, Taiwan (1997–2025, updated October 2026)
Creative Commons Attribution (CC BY): you may copy, share, adapt and reuse this content, also commercially, as long as you credit statistics.wiki and note any changes you made. The sources listed above may have their own license terms.