
List of countries by government spending (2025)
| Rank | Country | % of GDP | US$ | US$ per person |
|---|---|---|---|---|
 World |
37.2% | $43.4T | $5,428 | |
| 1 |  Nauru |
128.7% | $227M | $18,844 |
| 2 |  Libya |
101.7% | $48.9B | $6,559 |
| 3 |  East Timor |
89.3% | $1.70B | $1,197 |
| 4 |  Kiribati |
88.2% | $308M | $2,257 |
| 5 |  Tuvalu |
86.0% | $49.3M | $5,197 |
| 6 |  Marshall Islands |
75.1% | $231M | $6,371 |
| 7 |  Ukraine |
74.2% | $159B | $4,077 |
| 8 |  Dominica |
57.8% | $418M | $6,350 |
| 9 |  Finland |
57.5% | $182B | $32,285 |
| 10 |  France |
57.2% | $1.93T | $28,036 |
| 11 |  Austria |
55.1% | $319B | $34,672 |
| 12 |  Belgium |
54.2% | $393B | $32,925 |
| 13 |  Palau |
53.2% | $183M | $10,387 |
| 14 |  Italy |
51.2% | $1.31T | $22,158 |
| 15 |  Poland |
50.9% | $527B | $14,453 |
| 16 |  Germany |
50.1% | $2.53T | $30,318 |
| 17 |  Croatia |
50.1% | $52.6B | $13,569 |
| 18 |  Lesotho |
49.8% | $1.28B | $543 |
| 19 |  Slovenia |
49.1% | $39.1B | $18,364 |
| 20 |  Luxembourg |
49.1% | $49.6B | $72,255 |
| 21 |  Sweden |
48.9% | $327B | $30,888 |
| 22 |  Kuwait |
48.8% | $76.8B | $15,784 |
| 23 |  Norway |
48.7% | $258B | $46,064 |
| 24 |  Greece |
48.3% | $135B | $13,007 |
| 25 |  Slovakia |
47.9% | $74.1B | $13,685 |
| 26 |  Tonga |
47.8% | $325M | $3,133 |
| 27 |  Hungary |
47.3% | $117B | $12,245 |
| 28 |  Denmark |
47.2% | $218B | $36,352 |
| 29 |  Brazil |
46.9% | $1.07T | $5,028 |
| 30 |  Iceland |
45.7% | $17.6B | $44,888 |
| 31 |  Latvia |
45.4% | $22.1B | $11,936 |
| 32 |  Spain |
45.3% | $863B | $17,482 |
| 33 |  Netherlands |
45.2% | $602B | $33,304 |
| 34 |  Estonia |
45.1% | $21.2B | $15,539 |
| 35 |  Montenegro |
45.0% | $4.15B | $6,664 |
| 36 |  Bosnia |
44.1% | $14.4B | $4,581 |
| 37 |  Canada |
44.0% | $1.02T | $24,491 |
| 38 |  United Kingdom |
43.5% | $1.74T | $25,036 |
| 39 |  Israel |
43.2% | $264B | $26,059 |
| 40 |  Serbia |
43.2% | $43.2B | $6,589 |
| 41 |  Czech Republic |
43.1% | $169B | $15,484 |
| 42 |  Portugal |
42.7% | $148B | $13,695 |
| 43 |  Saint Kitts |
42.6% | $505M | $10,754 |
| 44 |  Iraq |
42.6% | $108B | $2,302 |
| 45 |  Solomon Islands |
42.1% | $736M | $878 |
| 46 |  New Zealand |
41.5% | $110B | $20,604 |
| 47 |  Saint Vincent |
41.4% | $520M | $5,200 |
| 48 |  Belarus |
41.3% | $38.5B | $4,241 |
| 49 |  Lithuania |
41.2% | $39.3B | $13,589 |
| 50 |  Romania |
40.3% | $173B | $9,090 |
| 51 |  Cyprus |
40.2% | $16.6B | $12,102 |
| 52 |  Australia |
39.6% | $712B | $25,767 |
| 53 |  Moldova |
39.4% | $8.02B | $3,396 |
| 54 |  Russia |
39.1% | $1.00T | $6,986 |
| 55 |  Bulgaria |
38.9% | $50.8B | $7,902 |
| 56 |  Namibia |
38.8% | $5.84B | $1,890 |
| 57 |  Ecuador |
38.4% | $50.0B | $2,733 |
| 58 |  Grenada |
38.0% | $540M | $4,600 |
| 59 |  Suriname |
37.8% | $1.71B | $2,669 |
| 60 |  United States |
37.6% | $11.6T | $33,813 |
| 61 |  Maldives |
37.0% | $2.86B | $5,405 |
| 62 |  Japan |
37.0% | $1.64T | $13,289 |
| 63 |  Malta |
36.9% | $10.2B | $17,674 |
| 64 |  Algeria |
36.8% | $106B | $2,226 |
| 65 |  Eswatini |
36.6% | $1.89B | $1,505 |
| 66 |  North Macedonia |
36.2% | $6.91B | $3,795 |
| 67 |  South Korea |
35.9% | $673B | $13,018 |
| 68 |  Kyrgyzstan |
35.9% | $8.11B | $1,105 |
| 69 |  Mongolia |
34.6% | $8.79B | $2,463 |
| 70 |  Azerbaijan |
34.6% | $26.3B | $2,563 |
| 71 |  Tunisia |
34.2% | $19.7B | $1,594 |
| 72 |  South Africa |
34.1% | $146B | $2,251 |
| 73 |  Jordan |
33.6% | $20.7B | $1,794 |
| 74 |  Colombia |
33.2% | $152B | $2,842 |
| 75 |  Vanuatu |
32.9% | $446M | $1,330 |
| 76 |  China |
32.9% | $6.41T | $4,558 |
| 77 |  Brunei |
32.9% | $4.94B | $10,593 |
| 78 |  Seychelles |
32.5% | $776M | $6,327 |
| 79 |  Jamaica |
32.3% | $7.33B | $2,585 |
| 80 |  Turkey |
32.3% | $516B | $6,005 |
| 81 |  Trinidad |
32.3% | $8.37B | $6,122 |
| 82 |  Switzerland |
31.8% | $332B | $36,532 |
| 83 |  Botswana |
31.6% | $6.31B | $2,461 |
| 84 |  Gabon |
31.5% | $6.75B | $2,604 |
| 85 |  Uruguay |
31.5% | $26.9B | $7,943 |
| 86 |  Eritrea |
31.3% (2019) | n/a | n/a |
| 87 |  Argentina |
31.1% | $213B | $4,638 |
| 88 |  Morocco |
31.0% | $56.6B | $1,473 |
| 89 |  Tajikistan |
30.9% | $5.46B | $506 |
| 90 |  Fiji |
30.9% | $1.92B | $2,053 |
| 91 |  Mozambique |
30.9% | $6.89B | $193.5 |
| 92 |  Mauritius |
30.7% | $4.96B | $3,992 |
| 93 |  El Salvador |
30.7% | $11.3B | $1,770 |
| 94 |  Albania |
30.3% | $9.24B | $3,935 |
| 95 |  Bhutan |
30.2% | $1.08B | $1,355 |
| 96 |  Mexico |
29.8% | $547B | $4,144 |
| 97 |  Zambia |
29.7% | $8.58B | $392 |
| 98 |  Armenia |
29.2% | $8.53B | $2,764 |
| 99 |  Saudi Arabia |
29.1% | $371B | $10,041 |
| 100 |  Malawi |
29.0% | $4.33B | $194.9 |
| 101 |  Oman |
28.7% | $31.5B | $5,728 |
| 102 |  Georgia |
28.4% | $10.8B | $2,756 |
| 103 |  India |
28.2% | $1.12T | $763 |
| 104 |  Bahrain |
28.2% | $13.8B | $8,628 |
| 105 |  Bolivia |
28.2% | $18.2B | $1,449 |
| 106 |  Qatar |
27.8% | $59.9B | $20,152 |
| 107 |  Gambia |
27.6% | $715M | $253.3 |
| 108 |  Uzbekistan |
27.4% | $40.2B | $1,086 |
| 109 |  Senegal |
27.2% | $10.1B | $532 |
| 110 |  Cape Verde |
27.2% | $831M | $1,577 |
| 111 |  Barbados |
27.1% | $2.17B | $7,692 |
| 112 |  Samoa |
26.4% | $340M | $1,550 |
| 113 |  Chile |
26.2% | $93.8B | $4,721 |
| 114 |  Belize |
25.9% | $862M | $2,039 |
| 115 |  Saint Lucia |
25.5% | $677M | $3,756 |
| 116 |  Myanmar |
25.2% | $20.6B | $376 |
| 117 |  Nicaragua |
25.2% | $5.61B | $800 |
| 118 |  Burkina Faso |
25.1% | $6.93B | $287.8 |
| 119 |  Honduras |
25.0% | $9.89B | $899 |
| 120 |  Philippines |
24.6% | $120B | $1,025 |
| 121 |  Congo |
24.0% | $3.91B | $603 |
| 122 |  Kenya |
24.0% | $32.6B | $566 |
| 123 |  Guyana |
23.5% | $6.37B | $7,623 |
| 124 |  Malaysia |
23.4% | $111B | $3,072 |
| 125 |  Rwanda |
23.3% | $3.81B | $261.4 |
| 126 |  Liberia |
23.0% | $1.20B | $210.2 |
| 127 |  Mauritania |
22.8% | $2.67B | $501 |
| 128 |  Thailand |
22.8% | $131B | $1,836 |
| 129 |  Egypt |
22.7% | $82.8B | $700 |
| 130 |  Ireland |
22.3% | $161B | $29,299 |
| 131 |  Sao Tome |
22.1% | $217M | $901 |
| 132 |  UAE |
21.8% | n/a | n/a |
| 133 |  Uganda |
21.6% | $13.4B | $261.1 |
| 134 |  Kazakhstan |
21.6% | $66.1B | $3,172 |
| 135 |  Nepal |
21.5% | $9.78B | $330 |
| 136 |  Comoros |
21.4% | $388M | $440 |
| 137 |  Peru |
21.4% | $71.5B | $2,069 |
| 138 |  Pakistan |
21.2% | $86.3B | $338 |
| 139 |  Venezuela |
21.1% | $21.0B | $736 |
| 140 |  San Marino |
21.1% | n/a | n/a |
| 141 |  Vietnam |
21.0% | $108B | $1,063 |
| 142 |  Afghanistan |
20.9% | n/a | n/a |
| 143 |  Panama |
20.9% | $18.9B | $4,142 |
| 144 |  Bahamas |
20.9% | n/a | n/a |
| 145 |  Mali |
20.1% | $6.06B | $240.3 |
| 146 |  Djibouti |
20.0% | $925M | $781 |
| 147 |  Ivory Coast |
20.0% | $19.9B | $609 |
| 148 |  Tanzania |
19.9% | $17.9B | $254.4 |
| 149 |  Togo |
19.8% | $2.35B | $273.8 |
| 150 |  Paraguay |
19.8% | $9.74B | $1,389 |
| 151 |  Burundi |
19.7% | $664M | $46.2 |
| 152 |  Laos |
19.7% | $3.61B | $459 |
| 153 |  Guinea-Bissau |
19.4% | $491M | $218.5 |
| 154 |  Dominican Republic |
19.3% | $24.6B | $2,136 |
| 155 |  Antigua |
19.2% | $450M | $4,774 |
| 156 |  Papua New Guinea |
19.1% | $6.22B | $578 |
| 157 |  Sri Lanka |
19.0% | $20.7B | $952 |
| 158 |  Angola |
19.0% | $23.2B | $594 |
| 159 |  Guinea |
18.9% | $5.37B | $355 |
| 160 |  Benin |
18.6% | $4.58B | $309 |
| 161 |  Chad |
18.6% | $4.00B | $190.5 |
| 162 |  South Sudan |
18.1% | n/a | n/a |
| 163 |  Costa Rica |
17.8% | $18.3B | $3,548 |
| 164 |  Yemen |
17.3% | n/a | n/a |
| 165 |  Ghana |
17.0% | $19.4B | $555 |
| 166 |  Sierra Leone |
17.0% | $1.27B | $143.6 |
| 167 |  DR Congo |
16.9% | $15.4B | $136.2 |
| 168 |  Equatorial Guinea |
16.9% | $2.16B | $1,116 |
| 169 |  Cameroon |
16.7% | $9.87B | $330 |
| 170 |  Indonesia |
16.2% | $234B | $819 |
| 171 |  Cambodia |
16.0% | $8.22B | $460 |
| 172 |  Niger |
15.6% | $3.37B | $120.7 |
| 173 |  Singapore |
15.5% | $93.7B | $15,328 |
| 174 |  Lebanon |
15.5% | n/a | n/a |
| 175 |  Iran |
14.6% | $52.9B | $572 |
| 176 |  CAR |
14.5% | $445M | $80.7 |
| 177 |  Guatemala |
14.5% | $17.8B | $955 |
| 178 |  Taiwan |
14.4% | $133B | $5,698 |
| 179 |  Zimbabwe |
14.2% | $7.27B | $429 |
| 180 |  Turkmenistan |
14.1% | $7.05B | $925 |
| 181 |  Madagascar |
13.5% | $2.65B | $81.1 |
| 182 |  Ethiopia |
12.0% | $15.2B | $112.4 |
| 183 |  Nigeria |
12.0% | $34.8B | $146.7 |
| 184 |  Bangladesh |
11.1% | $50.7B | $288.5 |
| 185 |  Sudan |
6.1% | $3.69B | $71.4 |
| 186 |  Haiti |
5.4% | $1.73B | $145.5 |
| Not ranked: latest data before 2015 | ||||
 Syria |
28.6% (2010) | $17.6B | $782 | |
The list ranks 186 countries by their latest government spending as a share of GDP, from Nauru (128.7%) to Haiti (5.4%). The world's government spending was 37.2% of GDP in 2025. Half of the countries had a government spending below 30.5% of GDP.
Government spending is what the general government (the central government together with state, regional and local governments and social security funds) spends in a year: wages, goods and services, social benefits such as pensions, subsidies, interest on its debt and investment in roads, buildings and equipment. The pages show it as a share of the country's GDP and in US dollars.
Government spending by country map: % of GDP, 1999–2025
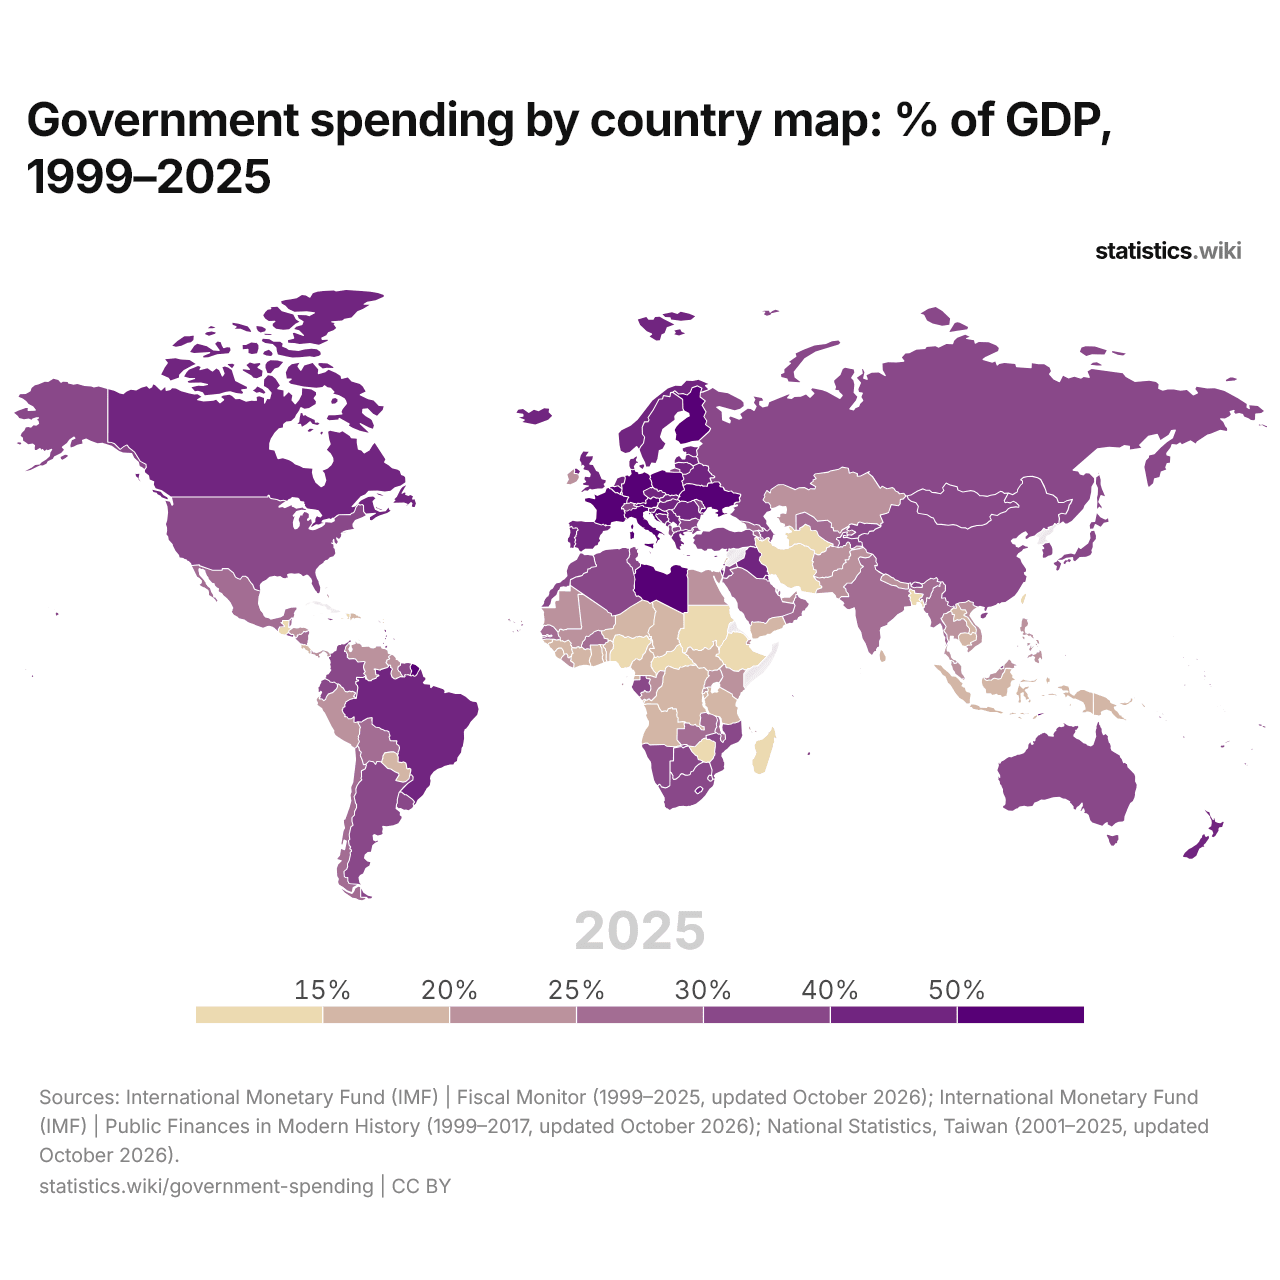
In 2025, government spending was below 20% of GDP in 40 countries and above 40% in 51; in 1999, it was below 20% in 46 and above 40% in 37.
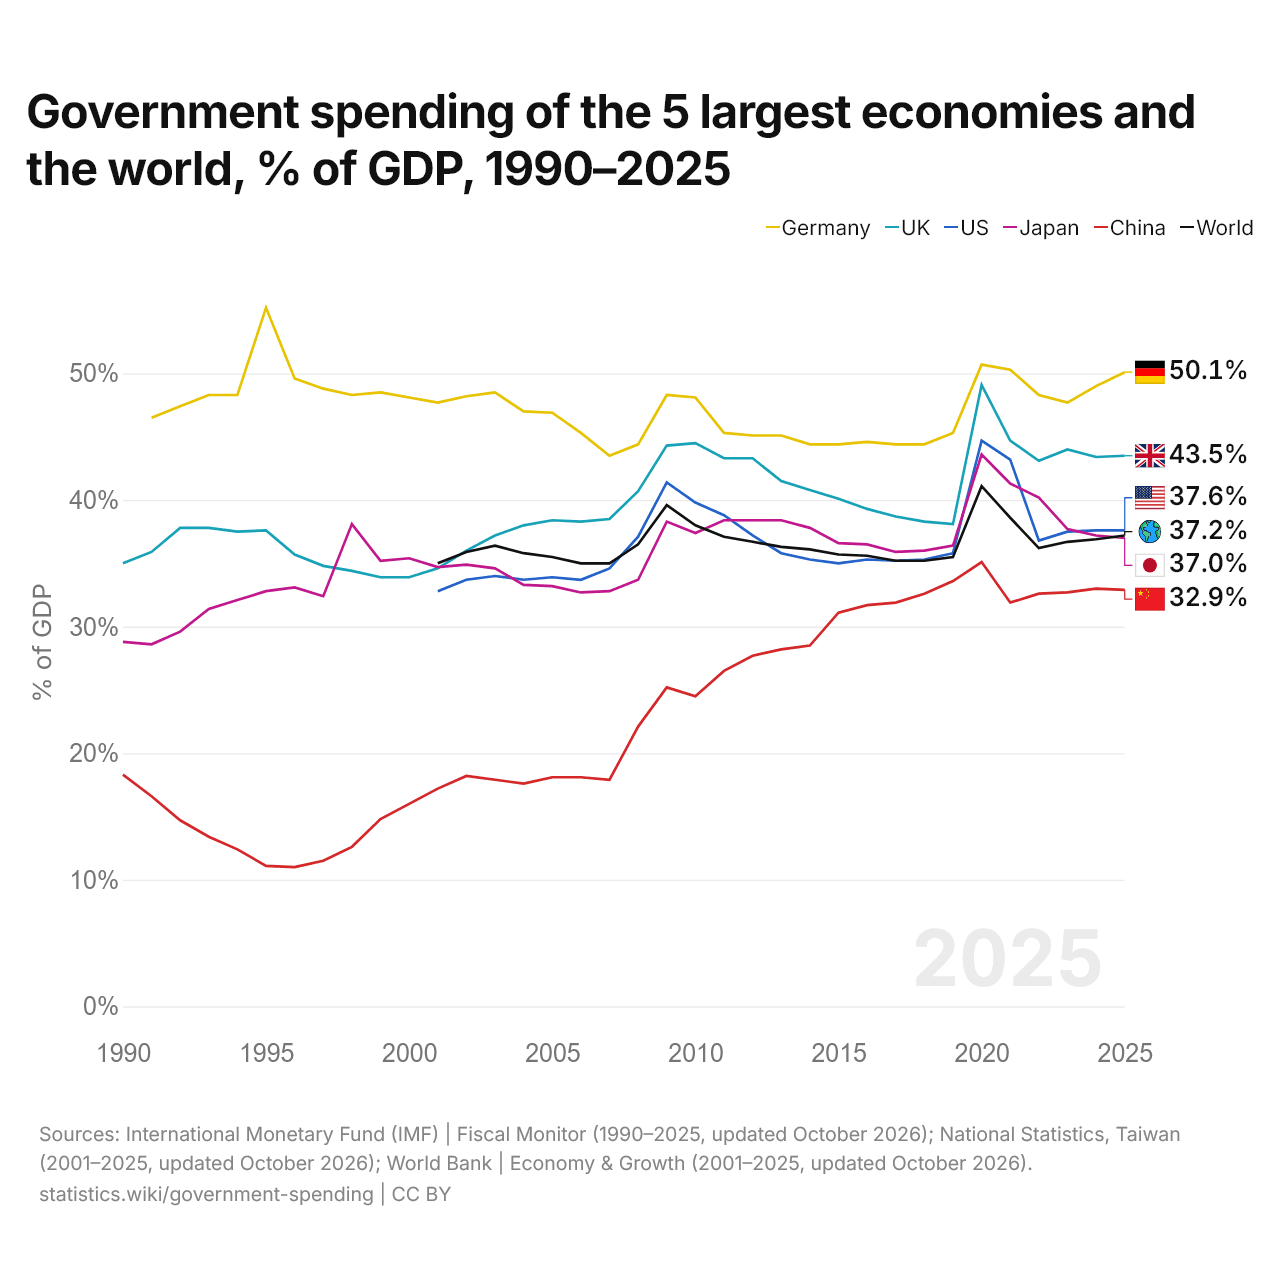
Government spending of the 5 largest economies and the world, % of GDP, 1990–2025
| Year | % of GDP | |||||
|---|---|---|---|---|---|---|
| Germany | United Kingdom | United States | Japan | China | World | |
| 2025 | 50.1% | 43.5% | 37.6% | 37% | 32.9% | 37.2% |
| 2024 | 49% | 43.4% | 37.6% | 37.2% | 33% | 36.9% |
| 2023 | 47.7% | 44% | 37.5% | 37.7% | 32.7% | 36.7% |
| 2022 | 48.3% | 43.1% | 36.8% | 40.2% | 32.6% | 36.2% |
| 2021 | 50.3% | 44.7% | 43.2% | 41.3% | 31.9% | 38.6% |
| 2020 | 50.7% | 49.1% | 44.7% | 43.6% | 35.1% | 41.1% |
| 2019 | 45.3% | 38.1% | 35.8% | 36.4% | 33.6% | 35.5% |
| 2018 | 44.4% | 38.3% | 35.3% | 36% | 32.6% | 35.2% |
| 2017 | 44.4% | 38.7% | 35.2% | 35.9% | 31.9% | 35.2% |
| 2016 | 44.6% | 39.3% | 35.3% | 36.5% | 31.7% | 35.6% |
| 2015 | 44.4% | 40.1% | 35% | 36.6% | 31.1% | 35.7% |
| 2014 | 44.4% | 40.8% | 35.3% | 37.8% | 28.5% | 36.1% |
| 2013 | 45.1% | 41.5% | 35.8% | 38.4% | 28.2% | 36.3% |
| 2012 | 45.1% | 43.3% | 37.2% | 38.4% | 27.7% | 36.7% |
| 2011 | 45.3% | 43.3% | 38.8% | 38.4% | 26.5% | 37.1% |
| 2010 | 48.1% | 44.5% | 39.8% | 37.4% | 24.5% | 38% |
| 2009 | 48.3% | 44.3% | 41.4% | 38.3% | 25.2% | 39.6% |
| 2008 | 44.4% | 40.7% | 37.1% | 33.7% | 22.1% | 36.5% |
| 2007 | 43.5% | 38.5% | 34.6% | 32.8% | 17.9% | 35% |
| 2006 | 45.3% | 38.3% | 33.7% | 32.7% | 18.1% | 35% |
| 2005 | 46.9% | 38.4% | 33.9% | 33.2% | 18.1% | 35.5% |
| 2004 | 47% | 38% | 33.7% | 33.3% | 17.6% | 35.8% |
| 2003 | 48.5% | 37.2% | 34% | 34.6% | 17.9% | 36.4% |
| 2002 | 48.2% | 36% | 33.7% | 34.9% | 18.2% | 35.9% |
| 2001 | 47.7% | 34.6% | 32.8% | 34.7% | 17.2% | 35% |
| 2000 | 48.1% | 33.9% | - | 35.4% | 16% | - |
| 1999 | 48.5% | 33.9% | - | 35.2% | 14.8% | - |
| 1998 | 48.3% | 34.4% | - | 38.1% | 12.6% | - |
| 1997 | 48.8% | 34.8% | - | 32.4% | 11.5% | - |
| 1996 | 49.6% | 35.7% | - | 33.1% | 11% | - |
| 1995 | 55.2% | 37.6% | - | 32.8% | 11.1% | - |
| 1994 | 48.3% | 37.5% | - | 32.1% | 12.4% | - |
| 1993 | 48.3% | 37.8% | - | 31.4% | 13.4% | - |
| 1992 | 47.4% | 37.8% | - | 29.6% | 14.7% | - |
| 1991 | 46.5% | 35.9% | - | 28.6% | 16.6% | - |
| 1990 | - | 35% | - | 28.8% | 18.3% | - |
In 2025, government spending was 50.1% of GDP in Germany, 43.5% in the United Kingdom, 37.6% in the United States, 37.0% in Japan and 32.9% in China. Germany's government spending has been the highest of the five as a share of GDP every year since 1991. The most recent change in their order came in 2024, when the United States passed Japan.
Compare the government spending of any 2 countries
Sources:
- International Monetary Fund (IMF) | Fiscal Monitor (1990–2025, updated October 2026)
- International Monetary Fund (IMF) | Public Finances in Modern History (1999–2017, updated October 2026)
- National Statistics, Taiwan (2001–2025, updated October 2026)
- World Bank | Economy & Growth (2001–2025, updated October 2026)
- U.S. Census Bureau (2025, updated October 2026)
Creative Commons Attribution (CC BY): you may copy, share, adapt and reuse this content, also commercially, as long as you credit statistics.wiki and note any changes you made. The sources listed above may have their own license terms.