
Budget deficit (−) or surplus (+) by country, 2025
| Rank | Country | % of GDP | US$ | Years in deficit since 2000 |
|---|---|---|---|---|
 World |
−5.1% | −$5.91T | 25 of 25 | |
| 1 |  East Timor |
−46.2% | −$880M | 23 of 25 |
| 2 |  Libya |
−30.5% | −$14.7B | 11 |
| 3 |  Brunei |
−17.7% | −$2.66B | 12 |
| 4 |  Ukraine |
−17.6% | −$37.7B | 26 |
| 5 |  Kiribati |
−14.5% | −$50.6M | 16 |
| 6 |  Bahrain |
−13.2% | −$6.44B | 19 |
| 7 |  Saint Vincent |
−13.0% | −$163M | 25 |
| 8 |  Gabon |
−12.1% | −$2.60B | 10 |
| 9 |  Saint Kitts |
−11.8% | −$139M | 16 |
| 10 |  Bolivia |
−11.4% | −$7.36B | 19 |
| 11 |  Algeria |
−10.5% | −$30.1B | 17 |
| 12 |  Malawi |
−10.2% | −$1.53B | 23 of 24 |
| 13 |  Suriname |
−8.3% | −$378M | 20 |
| 14 |  China |
−7.9% | −$1.53T | 25 |
| 15 |  Eswatini |
−7.8% | −$401M | 21 |
| 16 |  Romania |
−7.6% | −$32.7B | 26 |
| 17 |  Brazil |
−7.4% | −$169B | 25 of 25 |
| 18 |  India |
−7.4% | −$291B | 26 |
| 19 |  Poland |
−7.3% | −$75.2B | 26 |
| 20 |  United States |
−7.1% | −$2.17T | 25 of 25 |
| 21 |  Guinea-Bissau |
−6.7% | −$169M | 25 |
| 22 |  Uganda |
−6.6% | −$4.09B | 25 |
| 23 |  Egypt |
−6.6% | −$23.9B | 25 |
| 24 |  Kenya |
−6.5% | −$8.82B | 24 |
| 25 |  Senegal |
−6.4% | −$2.38B | 23 |
| 26 |  Guinea |
−6.4% | −$1.81B | 23 |
| 27 |  Iraq |
−6.2% | −$15.9B | 14 of 22 |
| 28 |  Jordan |
−6.2% | −$3.80B | 22 |
| 29 |  Botswana |
−6.1% | −$1.22B | 16 |
| 30 |  Namibia |
−5.9% | −$892M | 23 |
| 31 |  Saudi Arabia |
−5.8% | −$74.1B | 14 |
| 32 |  Colombia |
−5.8% | −$26.3B | 24 |
| 33 |  South Africa |
−5.6% | −$23.8B | 24 |
| 34 |  Guyana |
−5.5% | −$1.50B | 26 |
| 35 |  Trinidad |
−5.4% | −$1.41B | 17 |
| 36 |  Pakistan |
−5.4% | −$21.9B | 26 |
| 37 |  Iran |
−5.3% | −$19.2B | 24 |
| 38 |  Tunisia |
−5.3% | −$3.03B | 26 |
| 39 |  United Kingdom |
−5.3% | −$211B | 24 |
| 40 |  Belgium |
−5.2% | −$37.5B | 23 |
| 41 |  Israel |
−5.2% | −$31.6B | 25 |
| 42 |  Mozambique |
−5.1% | −$1.14B | 25 |
| 43 |  France |
−5.1% | −$170B | 26 |
| 44 |  Grenada |
−5.0% | −$71.7M | 17 |
| 45 |  Myanmar |
−4.9% | −$4.04B | 26 |
| 46 |  Mexico |
−4.9% | −$89.1B | 26 |
| 47 |  Gambia |
−4.7% | −$122M | 24 |
| 48 |  Hungary |
−4.7% | −$11.5B | 26 |
| 49 |  Venezuela |
−4.5% | −$4.52B | 22 |
| 50 |  Philippines |
−4.5% | −$21.7B | 22 |
| 51 |  Slovakia |
−4.5% | −$6.88B | 26 |
| 52 |  Rwanda |
−4.4% | −$712M | 22 |
| 53 |  Montenegro |
−4.3% | −$395M | 21 of 24 |
| 54 |  Austria |
−4.2% | −$24.2B | 24 |
| 55 |  Sierra Leone |
−4.2% | −$311M | 25 |
| 56 |  Angola |
−4.1% | −$4.96B | 13 |
| 57 |  Latvia |
−4.0% | −$1.97B | 24 |
| 58 |  North Macedonia |
−4.0% | −$766M | 22 |
| 59 |  New Zealand |
−4.0% | −$10.4B | 13 |
| 60 |  Yemen |
−3.9% | n/a | 8 of 8 |
| 61 |  Solomon Islands |
−3.9% | −$68.3M | 12 |
| 62 |  Russia |
−3.9% | −$99.1B | 12 |
| 63 |  Moldova |
−3.9% | −$784M | 22 |
| 64 |  Finland |
−3.8% | −$12.2B | 17 |
| 65 |  Zambia |
−3.8% | −$1.11B | 24 |
| 66 |  Mauritius |
−3.8% | −$614M | 26 |
| 67 |  CAR |
−3.8% | −$116M | 22 |
| 68 |  Armenia |
−3.7% | −$1.09B | 21 of 21 |
| 69 |  Panama |
−3.7% | −$3.32B | 22 |
| 70 |  Maldives |
−3.6% | −$282M | 26 |
| 71 |  Dominican Republic |
−3.6% | −$4.53B | 25 |
| 72 |  Malaysia |
−3.5% | −$16.7B | 26 |
| 73 |  Morocco |
−3.5% | −$6.41B | 25 |
| 74 |  Sao Tome |
−3.4% | −$33.6M | 18 |
| 75 |  Uruguay |
−3.4% | −$2.91B | 26 |
| 76 |  Costa Rica |
−3.4% | −$3.45B | 24 |
| 77 |  Togo |
−3.2% | −$383M | 23 |
| 78 |  Burundi |
−3.2% | −$108M | 26 |
| 79 |  Bangladesh |
−3.1% | −$14.3B | 26 |
| 80 |  Sudan |
−3.1% | −$1.86B | 22 |
| 81 |  Kazakhstan |
−3.1% | −$9.43B | 10 of 24 |
| 82 |  Italy |
−3.1% | −$78.4B | 26 |
| 83 |  Bulgaria |
−3.0% | −$3.94B | 17 |
| 84 |  Croatia |
−3.0% | −$3.16B | 22 |
| 85 |  Ivory Coast |
−3.0% | −$2.97B | 25 |
| 86 |  Indonesia |
−2.9% | −$42.2B | 23 |
| 87 |  Germany |
−2.9% | −$147B | 18 |
| 88 |  Niger |
−2.9% | −$630M | 24 |
| 89 |  Australia |
−2.9% | −$51.9B | 19 |
| 90 |  El Salvador |
−2.9% | −$1.05B | 26 |
| 91 |  Ecuador |
−2.8% | −$3.64B | 17 |
| 92 |  Chile |
−2.8% | −$9.89B | 18 |
| 93 |  Turkey |
−2.8% | −$44.1B | 26 |
| 94 |  Benin |
−2.7% | −$662M | 25 |
| 95 |  Bhutan |
−2.7% | −$95.7M | 22 |
| 96 |  Iceland |
−2.6% | −$1.02B | 17 |
| 97 |  Tanzania |
−2.6% | −$2.37B | 26 |
| 98 |  Jamaica |
−2.5% | −$575M | 18 |
| 99 |  Slovenia |
−2.5% | −$2.00B | 23 |
| 100 |  Bosnia |
−2.5% | −$807M | 18 |
| 101 |  DR Congo |
−2.4% | −$2.21B | 18 |
| 102 |  Fiji |
−2.4% | −$150M | 24 |
| 103 |  Spain |
−2.4% | −$45.5B | 23 |
| 104 |  Peru |
−2.4% | −$7.88B | 20 |
| 105 |  South Korea |
−2.3% | −$43.5B | 5 of 14 |
| 106 |  Sri Lanka |
−2.3% | −$2.48B | 26 |
| 107 |  Serbia |
−2.2% | −$2.21B | 21 |
| 108 |  Malta |
−2.2% | −$614M | 22 |
| 109 |  Czech Republic |
−2.1% | −$8.38B | 22 |
| 110 |  Papua New Guinea |
−2.1% | −$686M | 17 |
| 111 |  Liberia |
−2.1% | −$110M | 21 |
| 112 |  Madagascar |
−2.1% | −$411M | 26 |
| 113 |  Cameroon |
−2.1% | −$1.22B | 17 |
| 114 |  Estonia |
−2.0% | −$927M | 17 |
| 115 |  Luxembourg |
−2.0% | −$1.98B | 7 |
| 116 |  Guatemala |
−1.9% | −$2.32B | 26 |
| 117 |  Saint Lucia |
−1.9% | −$49.7M | 25 |
| 118 |  Nepal |
−1.8% | −$831M | 20 |
| 119 |  Lithuania |
−1.8% | −$1.74B | 22 |
| 120 |  Albania |
−1.8% | −$543M | 26 |
| 121 |  Nigeria |
−1.8% | −$5.11B | 19 |
| 122 |  Thailand |
−1.7% | −$9.95B | 14 |
| 123 |  Canada |
−1.7% | −$38.7B | 16 |
| 124 |  Paraguay |
−1.7% | −$816M | 17 |
| 125 |  Uzbekistan |
−1.6% | −$2.42B | 14 |
| 126 |  Netherlands |
−1.6% | −$21.5B | 19 |
| 127 |  Mali |
−1.5% | −$459M | 25 |
| 128 |  Burkina Faso |
−1.5% | −$419M | 25 |
| 129 |  Georgia |
−1.5% | −$556M | 22 |
| 130 |  Djibouti |
−1.4% | −$64.9M | 24 |
| 131 |  Ghana |
−1.3% | −$1.54B | 26 |
| 132 |  Comoros |
−1.3% | −$24.0M | 20 |
| 133 |  Sweden |
−1.3% | −$8.63B | 14 |
| 134 |  Ethiopia |
−1.2% | −$1.50B | 26 |
| 135 |  Belize |
−1.0% | −$34.5M | 25 |
| 136 |  Cambodia |
−1.0% | −$504M | 22 |
| 137 |  Seychelles |
−1.0% | −$23.4M | 13 |
| 138 |  Qatar |
−1.0% | −$2.06B | 4 |
| 139 |  Honduras |
−0.7% | −$295M | 22 |
| 140 |  Japan |
−0.7% | −$31.5B | 26 |
| 141 |  Equatorial Guinea |
−0.6% | −$78.9M | 12 |
| 142 |  Afghanistan |
−0.5% | n/a | 19 of 24 |
| 143 |  Bahamas |
−0.5% | n/a | 24 |
| 144 |  Dominica |
−0.5% | −$3.38M | 19 |
| 145 |  Palau |
−0.4% | −$1.43M | 15 |
| 146 |  Mauritania |
−0.3% | −$34.1M | 13 of 22 |
| 147 |  Haiti |
−0.3% | −$91.9M | 23 |
| 148 |  Chad |
−0.3% | −$55.6M | 18 |
| 149 |  Barbados |
−0.2% | −$19.5M | 23 |
| 150 |  Argentina |
−0.2% | −$1.07B | 19 |
| 151 |  Vietnam |
+0.0% | −$227M | 24 |
| 152 |  Turkmenistan |
+0.1% | +$31.4M | 8 |
| 153 |  Belarus |
+0.1% | +$59.1M | 18 of 25 |
| 154 |  Zimbabwe |
+0.1% | +$63.9M | 19 of 21 |
| 155 |  Switzerland |
+0.2% | +$2.43B | 8 |
| 156 |  Taiwan |
+0.3% | +$2.47B | 7 of 13 |
| 157 |  Tajikistan |
+0.5% | +$86.5M | 18 |
| 158 |  Oman |
+0.6% | +$625M | 9 |
| 159 |  San Marino |
+0.6% | n/a | 13 of 22 |
| 160 |  Portugal |
+0.7% | +$2.33B | 22 |
| 161 |  Congo |
+0.7% | +$119M | 8 |
| 162 |  Cape Verde |
+1.1% | +$32.5M | 25 |
| 163 |  Tonga |
+1.2% | +$7.98M | 7 |
| 164 |  Greece |
+1.7% | +$4.85B | 21 |
| 165 |  Ireland |
+1.9% | +$13.8B | 13 |
| 166 |  Laos |
+1.9% | +$352M | 23 |
| 167 |  Mongolia |
+2.2% | +$569M | 16 |
| 168 |  Azerbaijan |
+2.6% | +$1.94B | 4 |
| 169 |  Kyrgyzstan |
+2.6% | +$592M | 20 |
| 170 |  Eritrea |
+2.7% (2019) | n/a | 17 of 20 |
| 171 |  Denmark |
+2.9% | +$13.5B | 6 |
| 172 |  Antigua |
+3.2% | +$74.0M | 24 |
| 173 |  Lebanon |
+3.3% | n/a | 24 |
| 174 |  South Sudan |
+3.3% | n/a | 8 of 15 |
| 175 |  Cyprus |
+3.4% | +$1.40B | 17 |
| 176 |  Nicaragua |
+3.5% | +$780M | 10 |
| 177 |  Nauru |
+3.5% | +$6.19M | 0 of 17 |
| 178 |  UAE |
+3.9% | n/a | 6 |
| 179 |  Singapore |
+4.2% | +$25.2B | 2 |
| 180 |  Samoa |
+4.7% | +$60.3M | 16 |
| 181 |  Marshall Islands |
+4.8% | +$14.8M | 5 |
| 182 |  Lesotho |
+4.9% | +$126M | 14 |
| 183 |  Vanuatu |
+6.2% | +$83.7M | 16 |
| 184 |  Norway |
+10.6% | +$56.3B | 1 |
| 185 |  Kuwait |
+24.5% | +$38.5B | 0 |
| 186 |  Tuvalu |
+25.8% | +$14.8M | 12 of 22 |
| Not ranked: latest data before 2015 | ||||
 Syria |
−7.8% (2010) | −$4.78B | 10 of 11 | |
The list ranks 186 countries by their latest budget balance: 151 had a deficit and 35 a surplus. The world's governments together had a deficit of 5.1% of GDP in 2025. Half of the countries had a deficit larger than 2.7% of GDP.
The budget balance is what a government takes in during a year minus what it spends. A negative balance is a deficit, which the government covers by borrowing; a positive balance is a surplus. The figures are for the general government: the central government together with state, regional and local governments and social security funds. The pages show the balance as a share of the country's GDP and in US dollars.
Budget deficit (−) or surplus (+) by country, % of GDP, 1999–2025
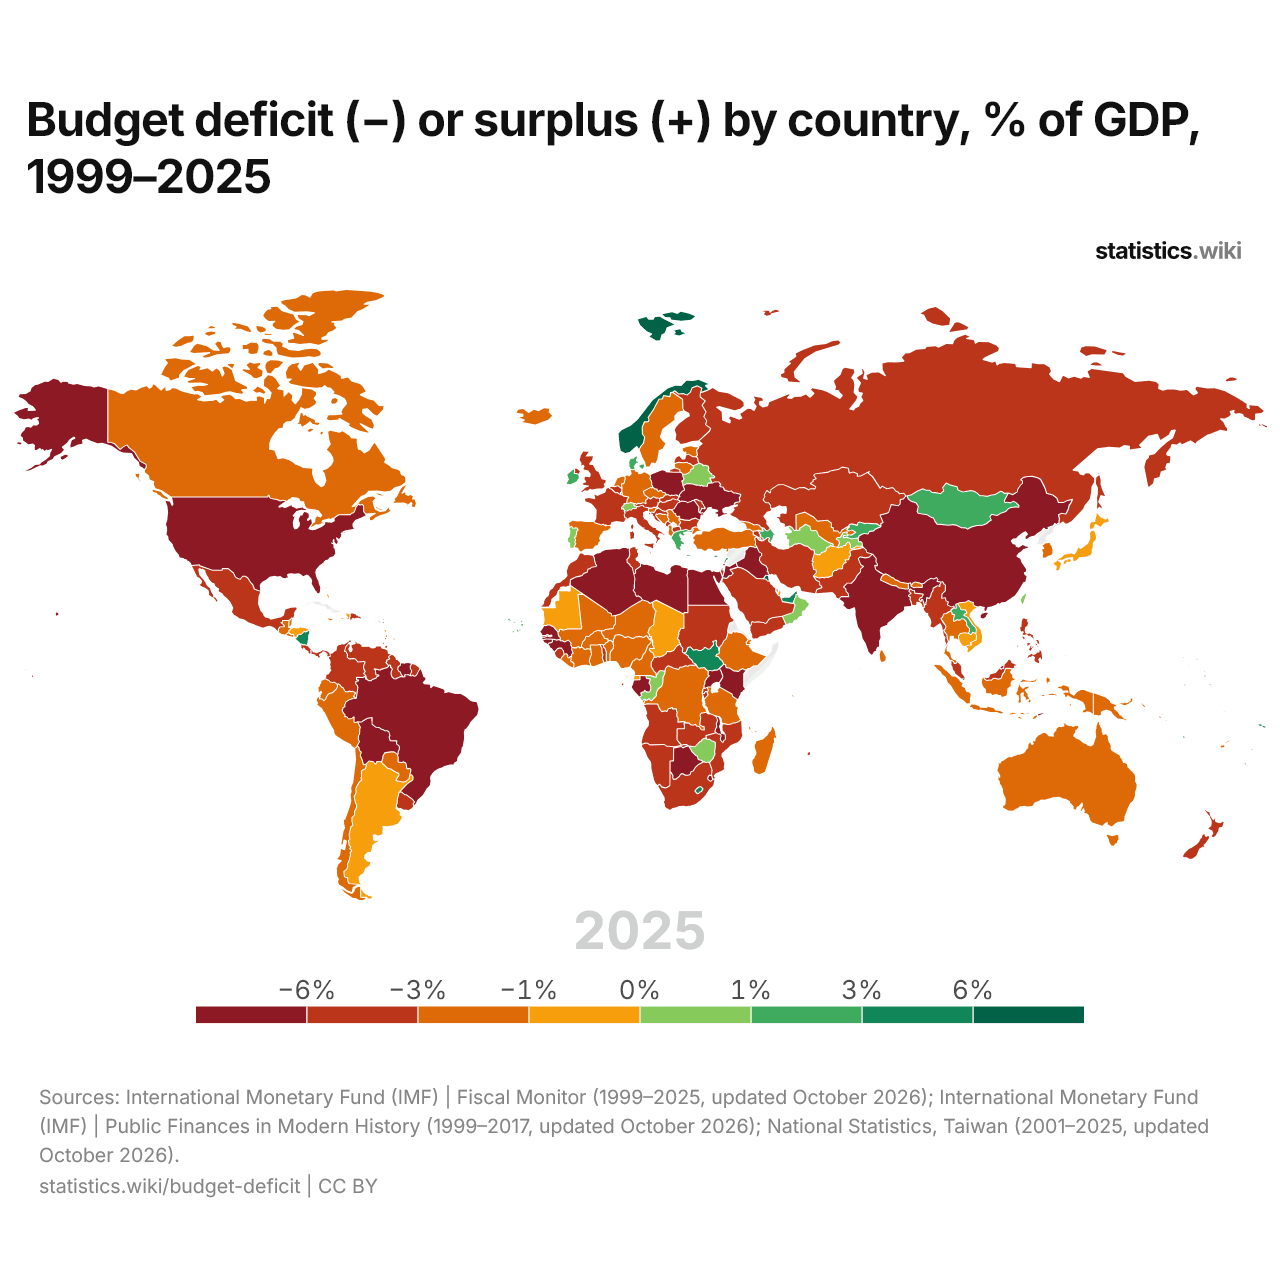
In 2025, 84 countries had a budget deficit of more than 3% of GDP and 15 a surplus of more than 3%; in 1999, the numbers were 63 and 11.
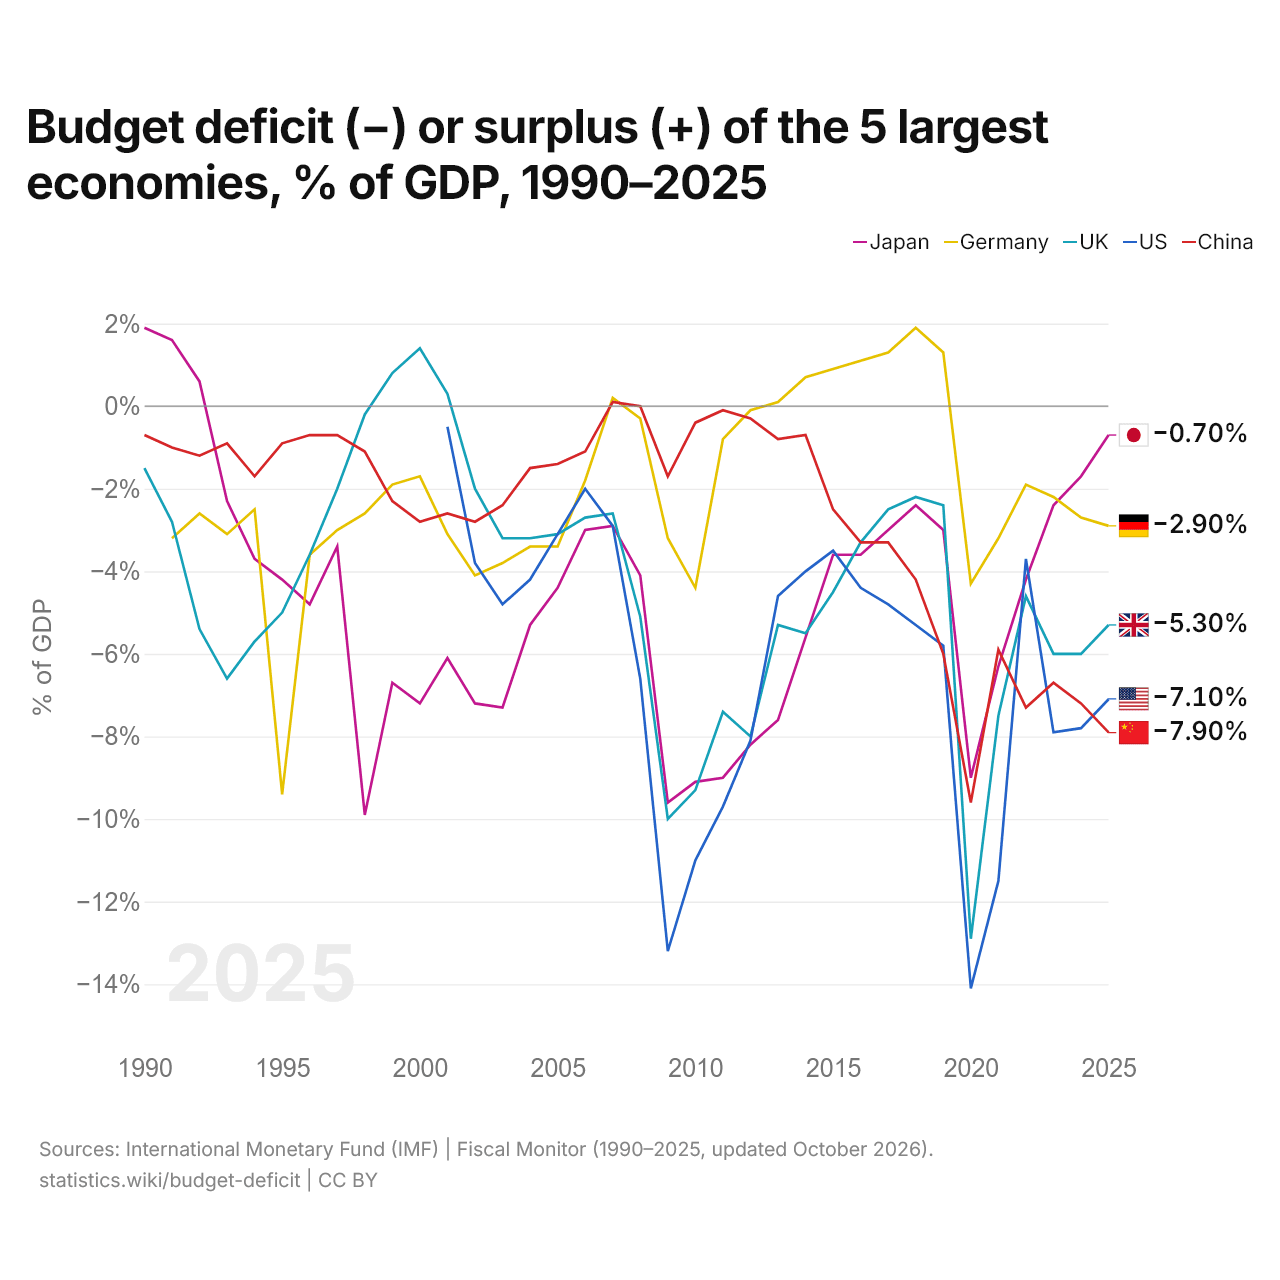
Budget deficit (−) or surplus (+) of the 5 largest economies, % of GDP, 1990–2025
| Year | % of GDP | ||||
|---|---|---|---|---|---|
| Japan | Germany | United Kingdom | United States | China | |
| 2025 | −0.7% | −2.9% | −5.3% | −7.1% | −7.9% |
| 2024 | −1.7% | −2.7% | −6% | −7.8% | −7.2% |
| 2023 | −2.4% | −2.2% | −6% | −7.9% | −6.7% |
| 2022 | −4.2% | −1.9% | −4.6% | −3.7% | −7.3% |
| 2021 | −6.3% | −3.2% | −7.5% | −11.5% | −5.9% |
| 2020 | −9% | −4.3% | −12.9% | −14.1% | −9.6% |
| 2019 | −3% | 1.3% | −2.4% | −5.8% | −6% |
| 2018 | −2.4% | 1.9% | −2.2% | −5.3% | −4.2% |
| 2017 | −3% | 1.3% | −2.5% | −4.8% | −3.3% |
| 2016 | −3.6% | 1.1% | −3.3% | −4.4% | −3.3% |
| 2015 | −3.6% | 0.9% | −4.5% | −3.5% | −2.5% |
| 2014 | −5.6% | 0.7% | −5.5% | −4% | −0.7% |
| 2013 | −7.6% | 0.1% | −5.3% | −4.6% | −0.8% |
| 2012 | −8.2% | −0.1% | −8% | −8.1% | −0.3% |
| 2011 | −9% | −0.8% | −7.4% | −9.7% | −0.1% |
| 2010 | −9.1% | −4.4% | −9.3% | −11% | −0.4% |
| 2009 | −9.6% | −3.2% | −10% | −13.2% | −1.7% |
| 2008 | −4.1% | −0.3% | −5.1% | −6.6% | 0% |
| 2007 | −2.9% | 0.2% | −2.6% | −2.9% | 0.1% |
| 2006 | −3% | −1.8% | −2.7% | −2% | −1.1% |
| 2005 | −4.4% | −3.4% | −3.1% | −3.1% | −1.4% |
| 2004 | −5.3% | −3.4% | −3.2% | −4.2% | −1.5% |
| 2003 | −7.3% | −3.8% | −3.2% | −4.8% | −2.4% |
| 2002 | −7.2% | −4.1% | −2% | −3.8% | −2.8% |
| 2001 | −6.1% | −3.1% | 0.3% | −0.5% | −2.6% |
| 2000 | −7.2% | −1.7% | 1.4% | - | −2.8% |
| 1999 | −6.7% | −1.9% | 0.8% | - | −2.3% |
| 1998 | −9.9% | −2.6% | −0.2% | - | −1.1% |
| 1997 | −3.4% | −3% | −2% | - | −0.7% |
| 1996 | −4.8% | −3.6% | −3.6% | - | −0.7% |
| 1995 | −4.2% | −9.4% | −5% | - | −0.9% |
| 1994 | −3.7% | −2.5% | −5.7% | - | −1.7% |
| 1993 | −2.3% | −3.1% | −6.6% | - | −0.9% |
| 1992 | 0.6% | −2.6% | −5.4% | - | −1.2% |
| 1991 | 1.6% | −3.2% | −2.8% | - | −1% |
| 1990 | 1.9% | - | −1.5% | - | −0.7% |
In 2025, the budget balance was −0.7% of GDP in Japan, −2.9% in Germany, −5.3% in the United Kingdom, −7.1% in the United States and −7.9% in China.
Countries with a budget surplus in 2025
-
Tuvalu
-
Kuwait
-
Norway
-
Vanuatu
-
Lesotho
-
Marshall
-
Samoa
-
Singapore
-
UAE
-
Nauru
-
Nicaragua
-
Cyprus
-
South Sudan
-
Lebanon
-
Antigua
-
Denmark
-
Kyrgyzstan
-
Azerbaijan
-
Mongolia
-
Laos
-
Ireland
-
Greece
-
Tonga
-
Cape Verde
-
Congo
-
Portugal
-
San Marino
-
Oman
-
Tajikistan
-
Taiwan
-
Switzerland
-
Zimbabwe
-
Belarus
-
Turkmenistan
The 10 largest budget deficits in 2025
In 2025, the largest budget surplus was Tuvalu's, 25.8% of GDP, and the largest deficit East Timor's, 46.2%.
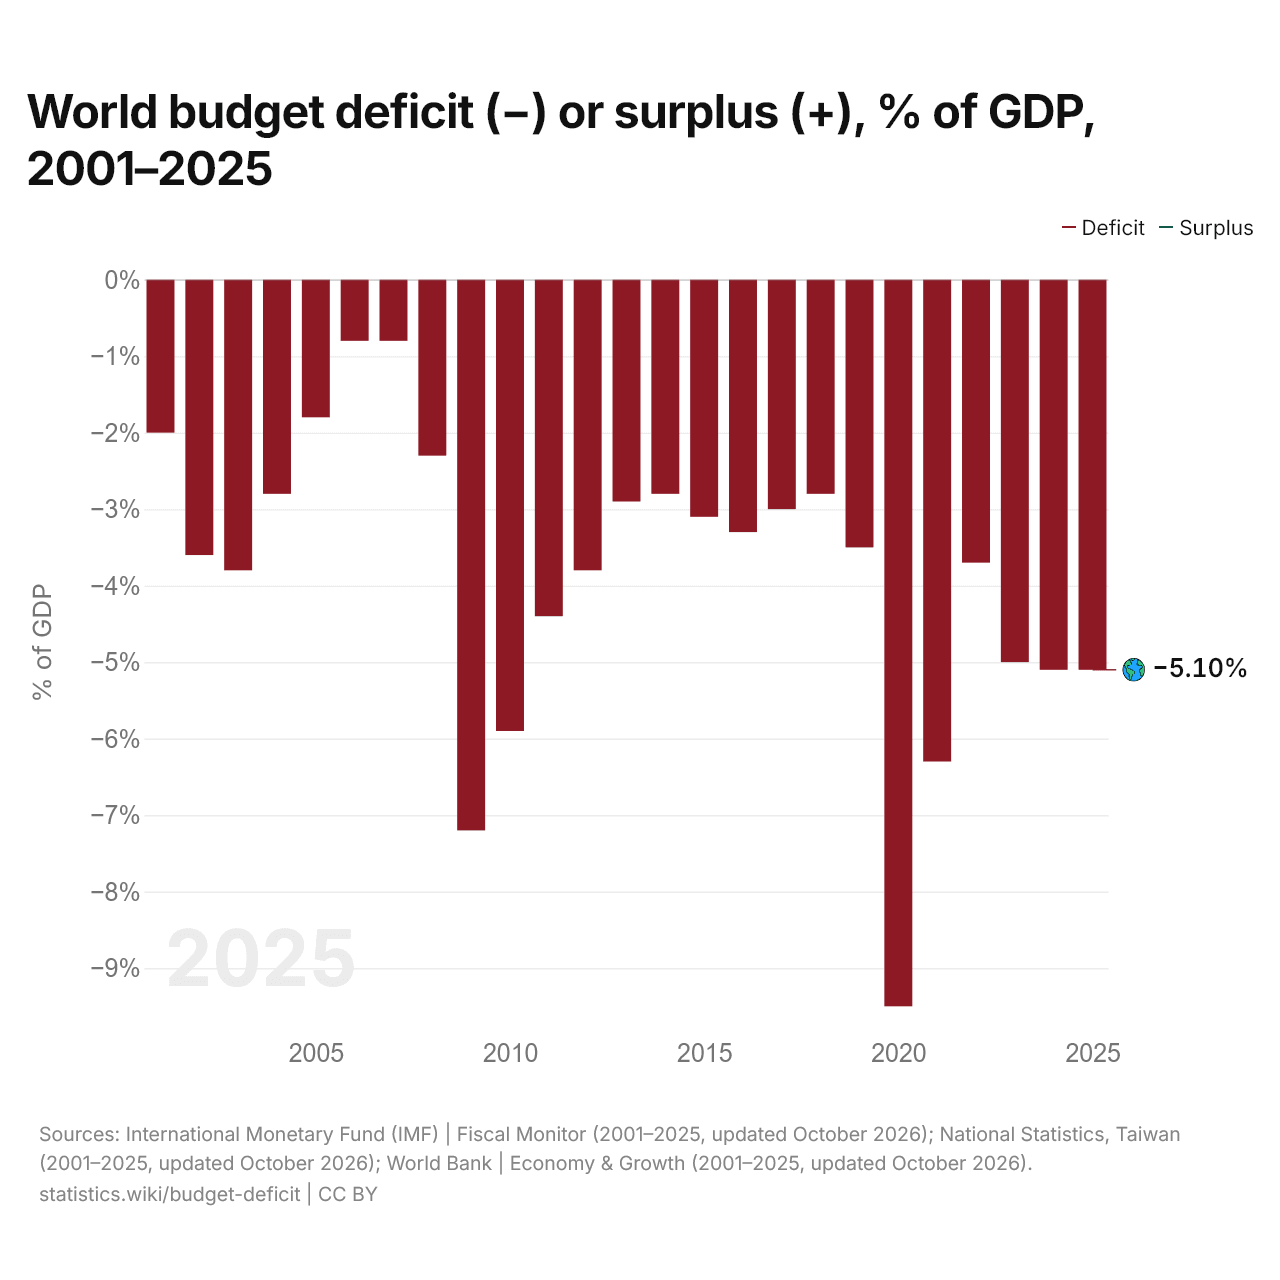
World budget deficit (−) or surplus (+), % of GDP, 2001–2025
| Year | % of GDP |
|---|---|
| World | |
| 2025 | −5.1% |
| 2024 | −5.1% |
| 2023 | −5% |
| 2022 | −3.7% |
| 2021 | −6.3% |
| 2020 | −9.5% |
| 2019 | −3.5% |
| 2018 | −2.8% |
| 2017 | −3% |
| 2016 | −3.3% |
| 2015 | −3.1% |
| 2014 | −2.8% |
| 2013 | −2.9% |
| 2012 | −3.8% |
| 2011 | −4.4% |
| 2010 | −5.9% |
| 2009 | −7.2% |
| 2008 | −2.3% |
| 2007 | −0.8% |
| 2006 | −0.8% |
| 2005 | −1.8% |
| 2004 | −2.8% |
| 2003 | −3.8% |
| 2002 | −3.6% |
| 2001 | −2% |
In 2025, the world's governments together had a budget deficit of 5.1% of GDP, compared with a deficit of 2.0% in 2001. The largest deficit was 9.5%, in 2020. They have had a deficit every year since 2001.
Compare the budget deficit of any 2 countries
Sources:
- International Monetary Fund (IMF) | Fiscal Monitor (1990–2025, updated October 2026)
- International Monetary Fund (IMF) | Public Finances in Modern History (1999–2017, updated October 2026)
- National Statistics, Taiwan (2001–2025, updated October 2026)
- World Bank | Economy & Growth (2001–2025, updated October 2026)
Creative Commons Attribution (CC BY): you may copy, share, adapt and reuse this content, also commercially, as long as you credit statistics.wiki and note any changes you made. The sources listed above may have their own license terms.