
Romania military spending (US$), 1987–2025
| Year | Military spending | World rank |
|---|---|---|
| Romania | ||
| 2025 | $9,778,858,161 | #33 |
| 2024 | $8,315,327,070 | #34 |
| 2023 | $5,624,969,941 | #41 |
| 2022 | $5,186,520,209 | #40 |
| 2021 | $5,294,923,565 | #41 |
| 2020 | $5,051,131,009 | #39 |
| 2019 | $4,607,679,466 | #40 |
| 2018 | $4,358,870,991 | #41 |
| 2017 | $3,643,441,024 | #43 |
| 2016 | $2,645,404,585 | #53 |
| 2015 | $2,580,612,052 | #57 |
| 2014 | $2,691,585,370 | #57 |
| 2013 | $2,452,635,953 | #60 |
| 2012 | $2,102,703,443 | #63 |
| 2011 | $2,380,001,520 | #58 |
| 2010 | $2,086,649,800 | #57 |
| 2009 | $2,225,253,810 | #53 |
| 2008 | $3,000,389,542 | #49 |
| 2007 | $2,607,689,942 | #48 |
| 2006 | $2,251,491,020 | #47 |
| 2005 | $1,975,973,117 | #47 |
| 2004 | $1,505,214,291 | #49 |
| 2003 | $1,207,278,895 | #52 |
| 2002 | $1,053,654,435 | #52 |
| 2001 | $977,862,841 | #50 |
| 2000 | $930,938,981 | #52 |
| 1999 | $949,256,553 | #54 |
| 1998 | $1,252,623,514 | #49 |
| 1997 | $1,073,535,434 | #53 |
| 1996 | $875,066,226 | #52 |
| 1995 | $978,217,705 | #52 |
| 1994 | $936,686,204 | #52 |
| 1993 | $722,456,076 | #56 |
| 1992 | $1,067,088,643 | #47 |
| 1991 | $1,377,137,357 | #39 |
| 1990 | $1,739,289,956 | #33 |
| 1989 | $1,988,516,524 | #28 |
| 1988 | $1,700,041,658 | #34 |
| 1987 | $1,489,975,490 | #32 |
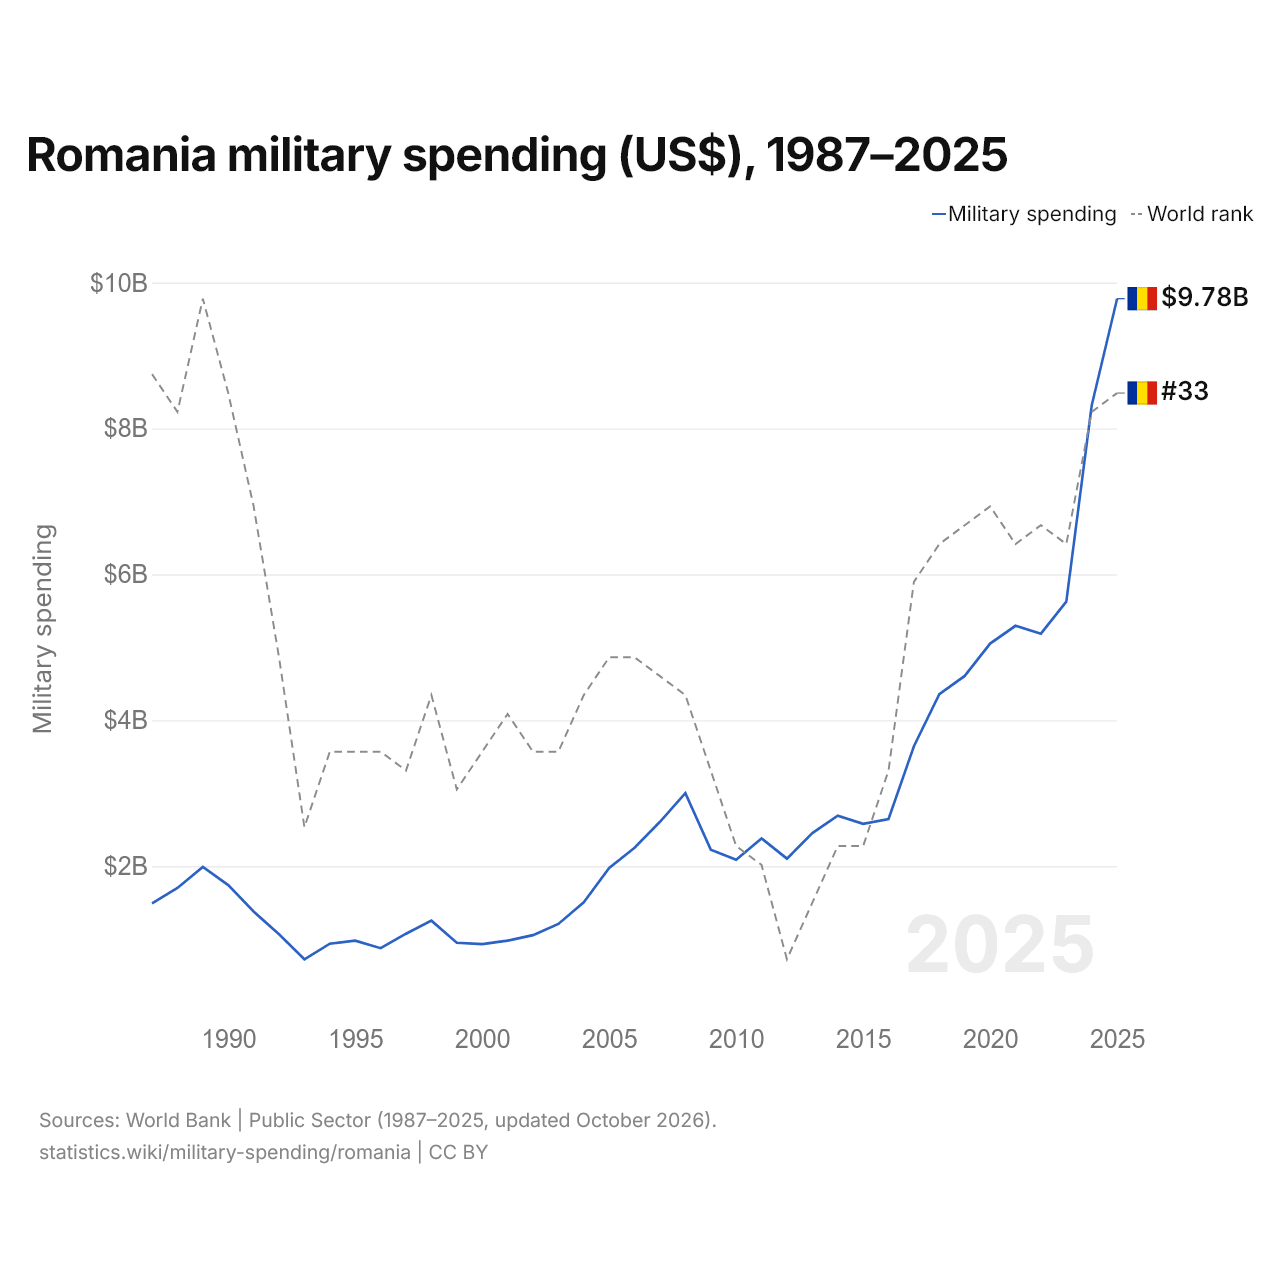
In 2025, Romania's military spending was $9.78 billion, up from $1.49 billion in 1987. Romania's was 0.34% of the world's military spending. It was lowest in 1993, at $722 million. It was the 33rd highest in the world, up from 34th in 2024. Its highest rank was 28th, last held in 1989.
Romania's military spending was the 14th highest of 40 countries in Europe, and 1.1% of the region's total. Romania's armed forces have 128,000 personnel, the 48th largest in the world.
Romania military spending as % of GDP, 1980–2025
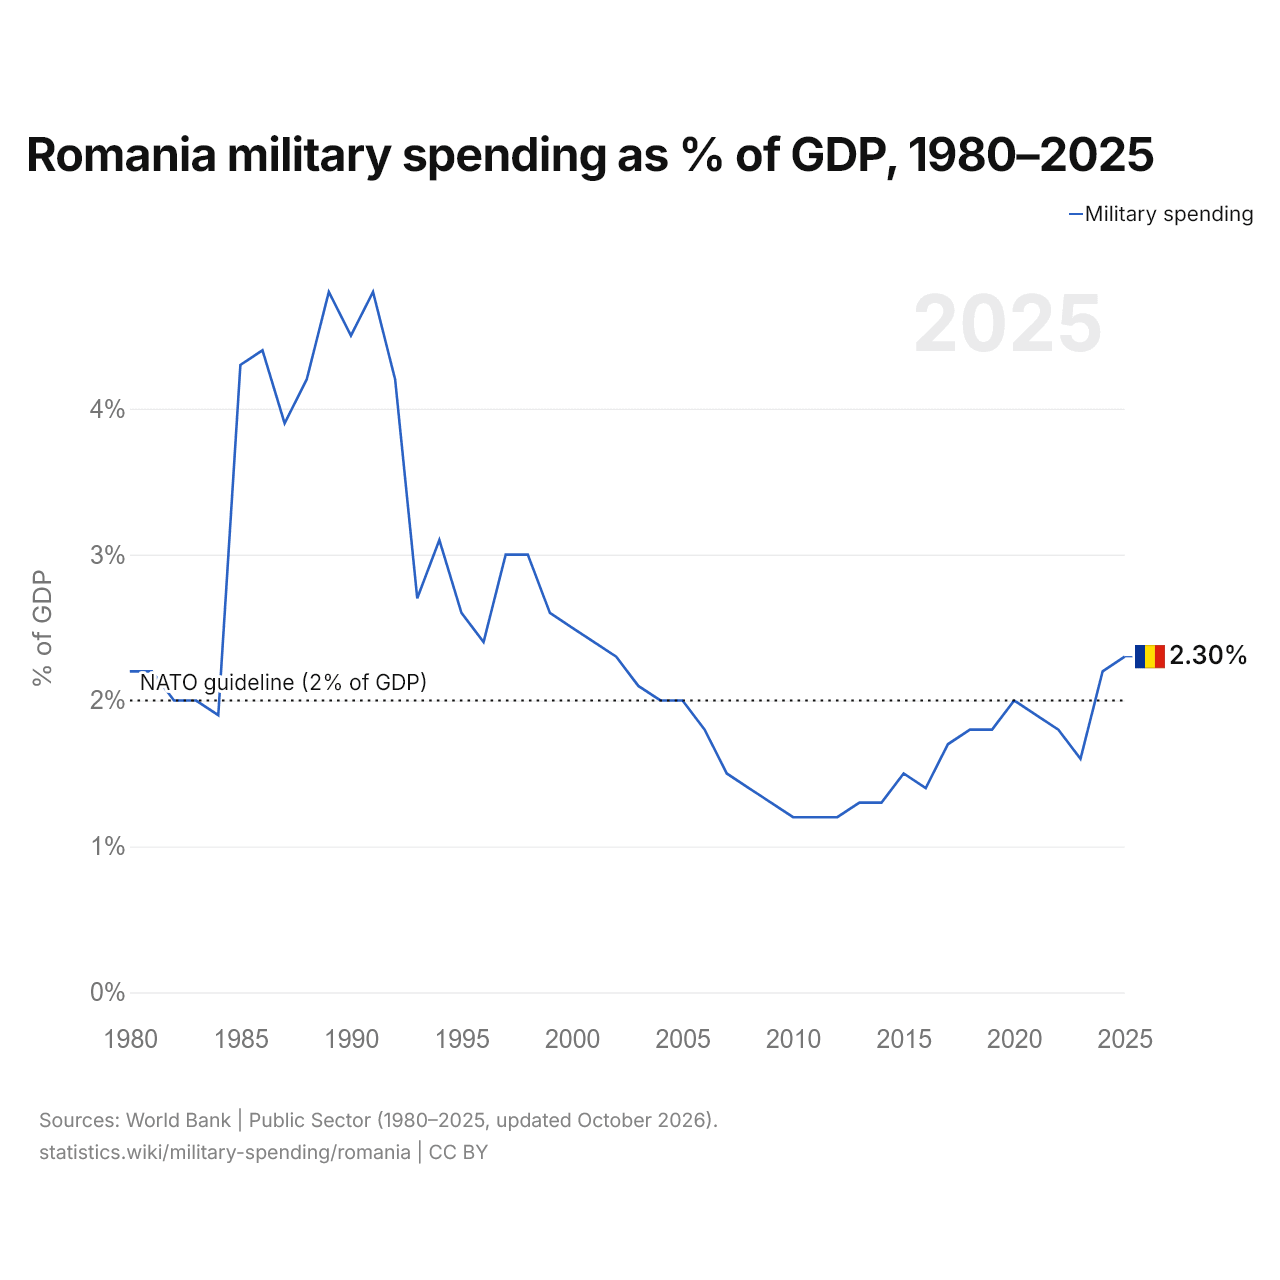
In 2025, Romania's military spending was 2.3% of GDP, up from 2.2% in 1980. It was highest in 1989, at 4.8%. Romania's spending was at or above the 2% of GDP that NATO members agreed to spend.
The largest ten-year rise in military spending in Romania was from 1980 to 1990, by 2.3 percentage points of GDP; the largest ten-year fall was from 1990 to 2000, by 2.0 points. Romania's military spending was at or above 2% of GDP in 28 of the years from 1980 to 2025, most recently in 2025.
Romania in the world military spending ranking, 2025
| Rank | Country | Military spending | % of GDP | US$ per person | Share of world | |
|---|---|---|---|---|---|---|
| 30 |
 Mexico |
$13.5B | 0.7% | $102.3 | 0.47% | |
| 31 |
 Pakistan |
$11.9B | 2.9% | $46.5 | 0.42% | vs Pakistan |
| 32 |
 Vietnam |
$11.1B | 2.2% | $109.1 | 0.39% | vs Vietnam |
| 33 |
 Romania |
$9.78B | 2.3% | $514 | 0.34% | |
| 34 |
 Greece |
$8.39B | 3.0% | $805 | 0.29% | vs Greece |
| 35 |
 Finland |
$8.15B | 2.6% | $1,444 | 0.29% | vs Finland |
| 36 |
 Switzerland |
$7.90B | 0.8% | $869 | 0.28% | vs Switzerland |
Compare Romania military spending with other countries
Sources:
- World Bank | Public Sector (1980–2025, updated October 2026)
Creative Commons Attribution (CC BY): you may copy, share, adapt and reuse this content, also commercially, as long as you credit statistics.wiki and note any changes you made. The sources listed above may have their own license terms.