
Népal vs Cambodge : PIB, 1960–2025
| Année | PIB, dollars US courants | |
|---|---|---|
 Népal |
 Cambodge |
|
| 2025 | 45 489 810 283 $ US | 51 267 065 843 $ US |
| 2024 | 43 298 911 700 $ US | 46 352 647 037 $ US |
| 2023 | 41 049 329 851 $ US | 42 335 646 896 $ US |
| 2022 | 41 182 939 520 $ US | 39 994 532 960 $ US |
| 2021 | 36 924 841 394 $ US | 36 790 163 687 $ US |
| 2020 | 33 433 659 301 $ US | 34 818 073 901 $ US |
| 2019 | 34 186 180 699 $ US | 36 685 356 408 $ US |
| 2018 | 33 111 525 237 $ US | 33 145 892 169 $ US |
| 2017 | 28 971 588 940 $ US | 29 355 665 910 $ US |
| 2016 | 24 524 109 484 $ US | 26 556 545 153 $ US |
| 2015 | 24 360 801 287 $ US | 24 174 170 369 $ US |
| 2014 | 22 731 612 922 $ US | 22 041 463 968 $ US |
| 2013 | 22 162 204 925 $ US | 19 807 135 253 $ US |
| 2012 | 21 703 100 877 $ US | 17 826 536 700 $ US |
| 2011 | 21 573 872 421 $ US | 16 032 622 024 $ US |
| 2010 | 16 002 656 434 $ US | 13 808 673 288 $ US |
| 2009 | 12 854 985 464 $ US | 12 502 901 170 $ US |
| 2008 | 12 545 438 605 $ US | 12 174 303 999 $ US |
| 2007 | 10 325 618 017 $ US | 10 127 916 460 $ US |
| 2006 | 9 043 715 356 $ US | 8 350 531 017 $ US |
| 2005 | 8 130 258 378 $ US | 7 066 296 463 $ US |
| 2004 | 7 273 938 315 $ US | 5 883 297 160 $ US |
| 2003 | 6 330 473 097 $ US | 5 046 693 484 $ US |
| 2002 | 6 050 875 807 $ US | 4 501 227 627 $ US |
| 2001 | 6 007 055 042 $ US | 4 145 665 970 $ US |
| 2000 | 5 494 252 208 $ US | 3 694 168 979 $ US |
| 1999 | 5 033 642 384 $ US | 3 517 242 477 $ US |
| 1998 | 4 856 255 044 $ US | 3 120 425 503 $ US |
| 1997 | 4 918 691 917 $ US | 3 443 413 389 $ US |
| 1996 | 4 521 580 381 $ US | 3 506 695 720 $ US |
| 1995 | 4 401 104 418 $ US | 3 441 205 693 $ US |
| 1994 | 4 066 775 510 $ US | 2 791 435 272 $ US |
| 1993 | 3 660 041 667 $ US | 2 533 727 592 $ US |
| 1992 | 3 401 211 581 $ US | 2 491 486 594 $ US |
| 1991 | 3 921 476 085 $ US | 2 054 974 089 $ US |
| 1990 | 3 627 560 239 $ US | 1 402 541 177 $ US |
| 1989 | 3 525 225 787 $ US | 1 353 137 648 $ US |
| 1988 | 3 487 009 748 $ US | 1 662 877 859 $ US |
| 1987 | 2 957 255 380 $ US | 1 036 974 910 $ US |
| 1986 | 2 850 782 044 $ US | 1 167 630 318 $ US |
| 1985 | 2 619 913 956 $ US | 1 102 669 184 $ US |
| 1984 | 2 581 207 388 $ US | 1 021 176 059 $ US |
| 1983 | 2 447 174 803 $ US | 939 291 262 $ US |
| 1982 | 2 395 423 742 $ US | 865 516 040 $ US |
| 1981 | 2 275 583 317 $ US | 815 153 652 $ US |
| 1980 | 1 945 916 583 $ US | 744 384 130 $ US |
| 1979 | 1 851 250 008 $ US | 723 738 503 $ US |
| 1978 | 1 604 162 497 $ US | 766 642 356 $ US |
| 1977 | 1 382 400 000 $ US | 716 261 764 $ US |
| 1976 | 1 452 788 985 $ US | 790 357 255 $ US |
| 1975 | 1 575 789 254 $ US | 749 129 748 $ US |
| 1974 | 1 217 953 547 $ US | - |
| 1973 | 972 101 725 $ US | - |
| 1972 | 1 024 098 400 $ US | - |
| 1971 | 882 765 472 $ US | - |
| 1970 | 865 975 309 $ US | - |
| 1969 | 788 641 965 $ US | - |
| 1968 | 772 231 387 $ US | - |
| 1967 | 841 974 025 $ US | - |
| 1966 | 906 811 944 $ US | - |
| 1965 | 735 267 082 $ US | - |
| 1964 | 496 098 775 $ US | - |
| 1963 | 496 947 904 $ US | - |
| 1962 | 574 091 101 $ US | - |
| 1961 | 531 959 562 $ US | - |
| 1960 | 508 334 414 $ US | - |
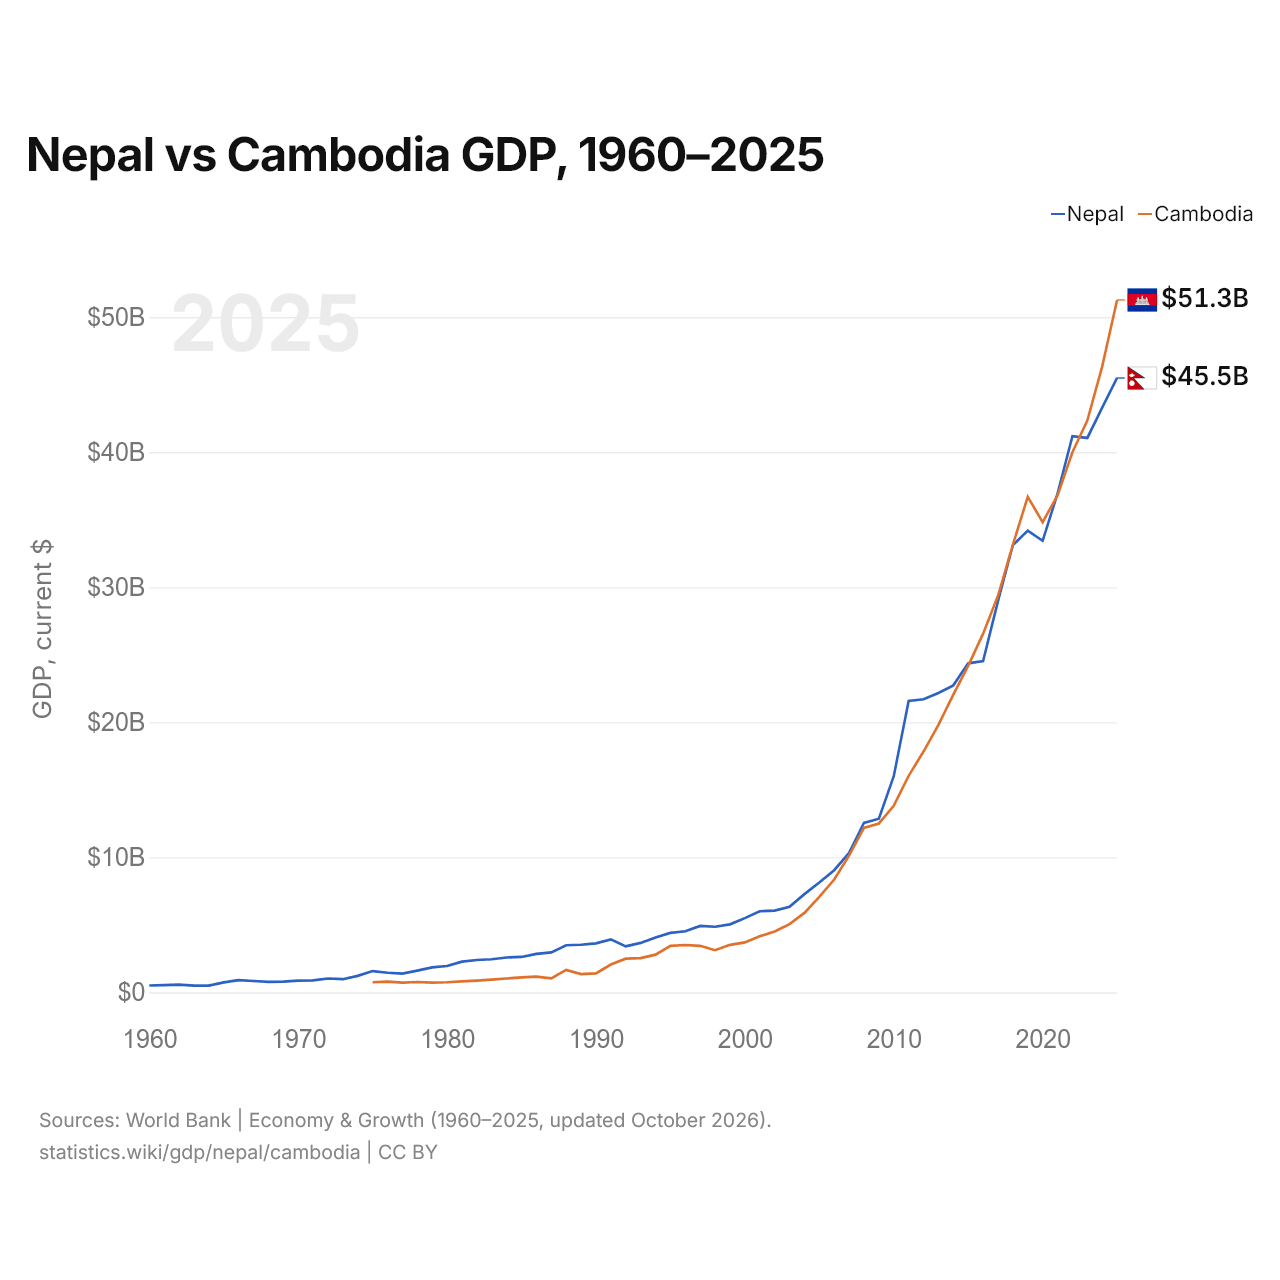
En 2025, le PIB du Cambodge (51,3 milliards de dollars US) était supérieur de 13 % à celui du Népal (45,5 milliards de dollars US). En 2015, le PIB du Cambodge était à peu près égal à celui du Népal. De 2015 à 2025, à prix constants de 2015, le PIB du Cambodge a progressé de 67,8 % et celui du Népal de 50,0 %.
Depuis 2023, le PIB du Cambodge est le plus élevé des deux ; en 1975, celui du Népal était 2,1 fois celui du Cambodge. En 2025, le PIB par habitant était de 1 536 $ US au Népal et de 2 872 $ US au Cambodge, soit 1,9 fois plus élevé au Cambodge. En parité de pouvoir d'achat, l'ordre s'inverse : le PIB (PPA) est de 183 milliards de dollars au Népal et de 152 milliards de dollars au Cambodge.
Népal vs Cambodge : derniers chiffres du PIB
|
Népal
|
Cambodge
|
|
|---|---|---|
| PIB, dollars US courants | 45,5 Md $US | 51,3 Md $US |
| Rang mondial | 102/197 | 94/197 |
| Part mondiale | 0,04 % | 0,04 % |
| PIB, dollars US constants de 2015 | 36,5 Md $US | 40,6 Md $US |
| Écart de PIB | 0,89× | 1,1× |
Comparer le PIB de 2 pays au choix
Sources :
- Banque mondiale | Économie et croissance (1960–2025, mis à jour en octobre 2026)
Creative Commons Attribution (CC BY) : vous pouvez copier, partager, adapter et réutiliser ce contenu, y compris à des fins commerciales, à condition de citer statistics.wiki et d’indiquer les modifications apportées. Les sources citées ci-dessus peuvent avoir leurs propres conditions de licence.