
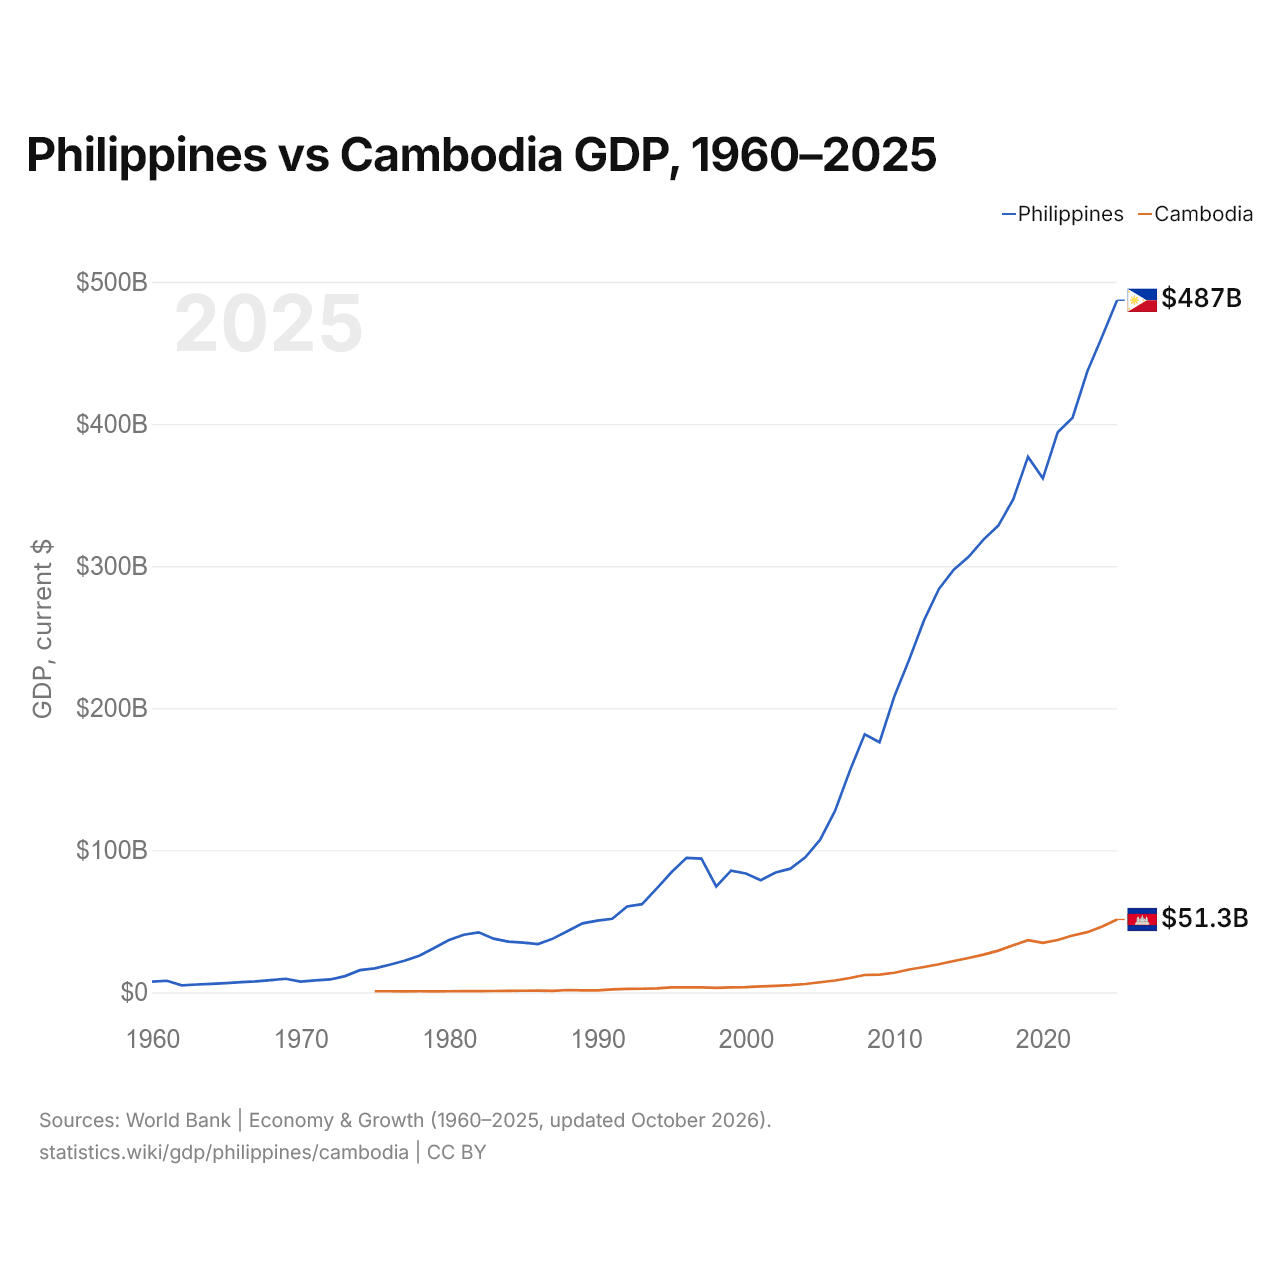
Philippines vs Cambodge : PIB, 1960–2025
| Année | PIB, dollars US courants | |
|---|---|---|
 Philippines |
 Cambodge |
|
| 2025 | 487 086 123 720 $ US | 51 267 065 843 $ US |
| 2024 | 461 671 157 905 $ US | 46 352 647 037 $ US |
| 2023 | 437 055 627 245 $ US | 42 335 646 896 $ US |
| 2022 | 404 353 369 605 $ US | 39 994 532 960 $ US |
| 2021 | 394 087 359 848 $ US | 36 790 163 687 $ US |
| 2020 | 361 751 145 452 $ US | 34 818 073 901 $ US |
| 2019 | 376 823 402 239 $ US | 36 685 356 408 $ US |
| 2018 | 346 841 896 587 $ US | 33 145 892 169 $ US |
| 2017 | 328 480 736 803 $ US | 29 355 665 910 $ US |
| 2016 | 318 627 003 017 $ US | 26 556 545 153 $ US |
| 2015 | 306 445 871 242 $ US | 24 174 170 369 $ US |
| 2014 | 297 483 555 338 $ US | 22 041 463 968 $ US |
| 2013 | 283 902 828 589 $ US | 19 807 135 253 $ US |
| 2012 | 261 920 540 963 $ US | 17 826 536 700 $ US |
| 2011 | 234 216 730 291 $ US | 16 032 622 024 $ US |
| 2010 | 208 368 893 151 $ US | 13 808 673 288 $ US |
| 2009 | 175 974 755 881 $ US | 12 502 901 170 $ US |
| 2008 | 181 624 626 327 $ US | 12 174 303 999 $ US |
| 2007 | 155 980 408 673 $ US | 10 127 916 460 $ US |
| 2006 | 127 652 926 368 $ US | 8 350 531 017 $ US |
| 2005 | 107 419 977 318 $ US | 7 066 296 463 $ US |
| 2004 | 95 001 999 685 $ US | 5 883 297 160 $ US |
| 2003 | 87 039 092 974 $ US | 5 046 693 484 $ US |
| 2002 | 84 307 345 888 $ US | 4 501 227 627 $ US |
| 2001 | 78 921 234 458 $ US | 4 145 665 970 $ US |
| 2000 | 83 669 788 377 $ US | 3 694 168 979 $ US |
| 1999 | 85 640 171 045 $ US | 3 517 242 477 $ US |
| 1998 | 74 492 416 330 $ US | 3 120 425 503 $ US |
| 1997 | 94 106 317 565 $ US | 3 443 413 389 $ US |
| 1996 | 94 648 084 429 $ US | 3 506 695 720 $ US |
| 1995 | 84 644 328 727 $ US | 3 441 205 693 $ US |
| 1994 | 73 159 336 915 $ US | 2 791 435 272 $ US |
| 1993 | 62 036 529 147 $ US | 2 533 727 592 $ US |
| 1992 | 60 422 328 242 $ US | 2 491 486 594 $ US |
| 1991 | 51 784 144 943 $ US | 2 054 974 089 $ US |
| 1990 | 50 508 286 642 $ US | 1 402 541 177 $ US |
| 1989 | 48 513 773 721 $ US | 1 353 137 648 $ US |
| 1988 | 43 152 128 959 $ US | 1 662 877 859 $ US |
| 1987 | 37 791 488 666 $ US | 1 036 974 910 $ US |
| 1986 | 33 987 207 295 $ US | 1 167 630 318 $ US |
| 1985 | 34 961 486 348 $ US | 1 102 669 184 $ US |
| 1984 | 35 730 185 634 $ US | 1 021 176 059 $ US |
| 1983 | 37 759 179 895 $ US | 939 291 262 $ US |
| 1982 | 42 206 011 275 $ US | 865 516 040 $ US |
| 1981 | 40 499 388 869 $ US | 815 153 652 $ US |
| 1980 | 36 848 080 899 $ US | 744 384 130 $ US |
| 1979 | 31 218 296 292 $ US | 723 738 503 $ US |
| 1978 | 25 762 224 563 $ US | 766 642 356 $ US |
| 1977 | 22 283 109 803 $ US | 716 261 764 $ US |
| 1976 | 19 381 055 197 $ US | 790 357 255 $ US |
| 1975 | 16 875 240 684 $ US | 749 129 748 $ US |
| 1974 | 15 607 882 555 $ US | - |
| 1973 | 11 412 449 735 $ US | - |
| 1972 | 9 067 815 521 $ US | - |
| 1971 | 8 375 075 630 $ US | - |
| 1970 | 7 559 115 517 $ US | - |
| 1969 | 9 571 800 653 $ US | - |
| 1968 | 8 632 749 269 $ US | - |
| 1967 | 7 724 873 935 $ US | - |
| 1966 | 7 189 017 888 $ US | - |
| 1965 | 6 517 349 772 $ US | - |
| 1964 | 5 953 756 195 $ US | - |
| 1963 | 5 505 023 238 $ US | - |
| 1962 | 4 954 593 072 $ US | - |
| 1961 | 8 171 194 425 $ US | - |
| 1960 | 7 515 894 111 $ US | - |
En 2025, le PIB des Philippines (487 milliards de dollars US) était 9,5 fois celui du Cambodge (51,3 milliards de dollars US). En 2015, le rapport était de 13. De 2015 à 2025, à prix constants de 2015, le PIB des Philippines a progressé de 55,0 % et celui du Cambodge de 67,8 %.
Depuis 1975, le PIB des Philippines a chaque année été le plus élevé des deux ; en 1975, il était 23 fois celui du Cambodge. En 2025, le PIB par habitant était de 4 171 $ US aux Philippines et de 2 872 $ US au Cambodge, soit 45 % de plus aux Philippines.
Philippines vs Cambodge : derniers chiffres du PIB
|
Philippines
|
Cambodge
|
|
|---|---|---|
| PIB, dollars US courants | 487 Md $US | 51,3 Md $US |
| Rang mondial | 34/197 | 94/197 |
| Part mondiale | 0,41 % | 0,04 % |
| PIB, dollars US constants de 2015 | 475 Md $US | 40,6 Md $US |
| Écart de PIB | 9,5× | 0,11× |
Comparer le PIB de 2 pays au choix
Sources :
- Banque mondiale | Économie et croissance (1960–2025, mis à jour en octobre 2026)
Creative Commons Attribution (CC BY) : vous pouvez copier, partager, adapter et réutiliser ce contenu, y compris à des fins commerciales, à condition de citer statistics.wiki et d’indiquer les modifications apportées. Les sources citées ci-dessus peuvent avoir leurs propres conditions de licence.