
Népal vs Afghanistan : PIB, 1960–2025
| Année | PIB, dollars US courants | |
|---|---|---|
 Népal |
 Afghanistan |
|
| 2025 | 45 489 810 283 $ US | - |
| 2024 | 43 298 911 700 $ US | 17 778 508 876 $ US |
| 2023 | 41 049 329 851 $ US | 17 152 234 637 $ US |
| 2022 | 41 182 939 520 $ US | 14 497 243 872 $ US |
| 2021 | 36 924 841 394 $ US | 14 259 995 441 $ US |
| 2020 | 33 433 659 301 $ US | 19 955 929 052 $ US |
| 2019 | 34 186 180 699 $ US | 18 799 444 490 $ US |
| 2018 | 33 111 525 237 $ US | 18 053 222 687 $ US |
| 2017 | 28 971 588 940 $ US | 18 753 456 498 $ US |
| 2016 | 24 524 109 484 $ US | 18 116 572 395 $ US |
| 2015 | 24 360 801 287 $ US | 19 134 221 645 $ US |
| 2014 | 22 731 612 922 $ US | 20 497 128 556 $ US |
| 2013 | 22 162 204 925 $ US | 20 146 416 758 $ US |
| 2012 | 21 703 100 877 $ US | 19 907 329 778 $ US |
| 2011 | 21 573 872 421 $ US | 17 805 098 206 $ US |
| 2010 | 16 002 656 434 $ US | 15 856 668 556 $ US |
| 2009 | 12 854 985 464 $ US | 12 416 152 732 $ US |
| 2008 | 12 545 438 605 $ US | 10 109 297 048 $ US |
| 2007 | 10 325 618 017 $ US | 9 747 886 187 $ US |
| 2006 | 9 043 715 356 $ US | 6 971 758 282 $ US |
| 2005 | 8 130 258 378 $ US | 6 203 256 539 $ US |
| 2004 | 7 273 938 315 $ US | 5 224 896 719 $ US |
| 2003 | 6 330 473 097 $ US | 4 520 946 819 $ US |
| 2002 | 6 050 875 807 $ US | 3 825 701 439 $ US |
| 2001 | 6 007 055 042 $ US | 2 813 571 754 $ US |
| 2000 | 5 494 252 208 $ US | 3 521 418 060 $ US |
| 1999 | 5 033 642 384 $ US | - |
| 1998 | 4 856 255 044 $ US | - |
| 1997 | 4 918 691 917 $ US | - |
| 1996 | 4 521 580 381 $ US | - |
| 1995 | 4 401 104 418 $ US | - |
| 1994 | 4 066 775 510 $ US | - |
| 1993 | 3 660 041 667 $ US | - |
| 1992 | 3 401 211 581 $ US | - |
| 1991 | 3 921 476 085 $ US | - |
| 1990 | 3 627 560 239 $ US | - |
| 1989 | 3 525 225 787 $ US | - |
| 1988 | 3 487 009 748 $ US | - |
| 1987 | 2 957 255 380 $ US | - |
| 1986 | 2 850 782 044 $ US | - |
| 1985 | 2 619 913 956 $ US | - |
| 1984 | 2 581 207 388 $ US | - |
| 1983 | 2 447 174 803 $ US | - |
| 1982 | 2 395 423 742 $ US | - |
| 1981 | 2 275 583 317 $ US | - |
| 1980 | 1 945 916 583 $ US | - |
| 1979 | 1 851 250 008 $ US | - |
| 1978 | 1 604 162 497 $ US | - |
| 1977 | 1 382 400 000 $ US | - |
| 1976 | 1 452 788 985 $ US | - |
| 1975 | 1 575 789 254 $ US | - |
| 1974 | 1 217 953 547 $ US | - |
| 1973 | 972 101 725 $ US | - |
| 1972 | 1 024 098 400 $ US | - |
| 1971 | 882 765 472 $ US | - |
| 1970 | 865 975 309 $ US | - |
| 1969 | 788 641 965 $ US | - |
| 1968 | 772 231 387 $ US | - |
| 1967 | 841 974 025 $ US | - |
| 1966 | 906 811 944 $ US | - |
| 1965 | 735 267 082 $ US | - |
| 1964 | 496 098 775 $ US | - |
| 1963 | 496 947 904 $ US | - |
| 1962 | 574 091 101 $ US | - |
| 1961 | 531 959 562 $ US | - |
| 1960 | 508 334 414 $ US | - |
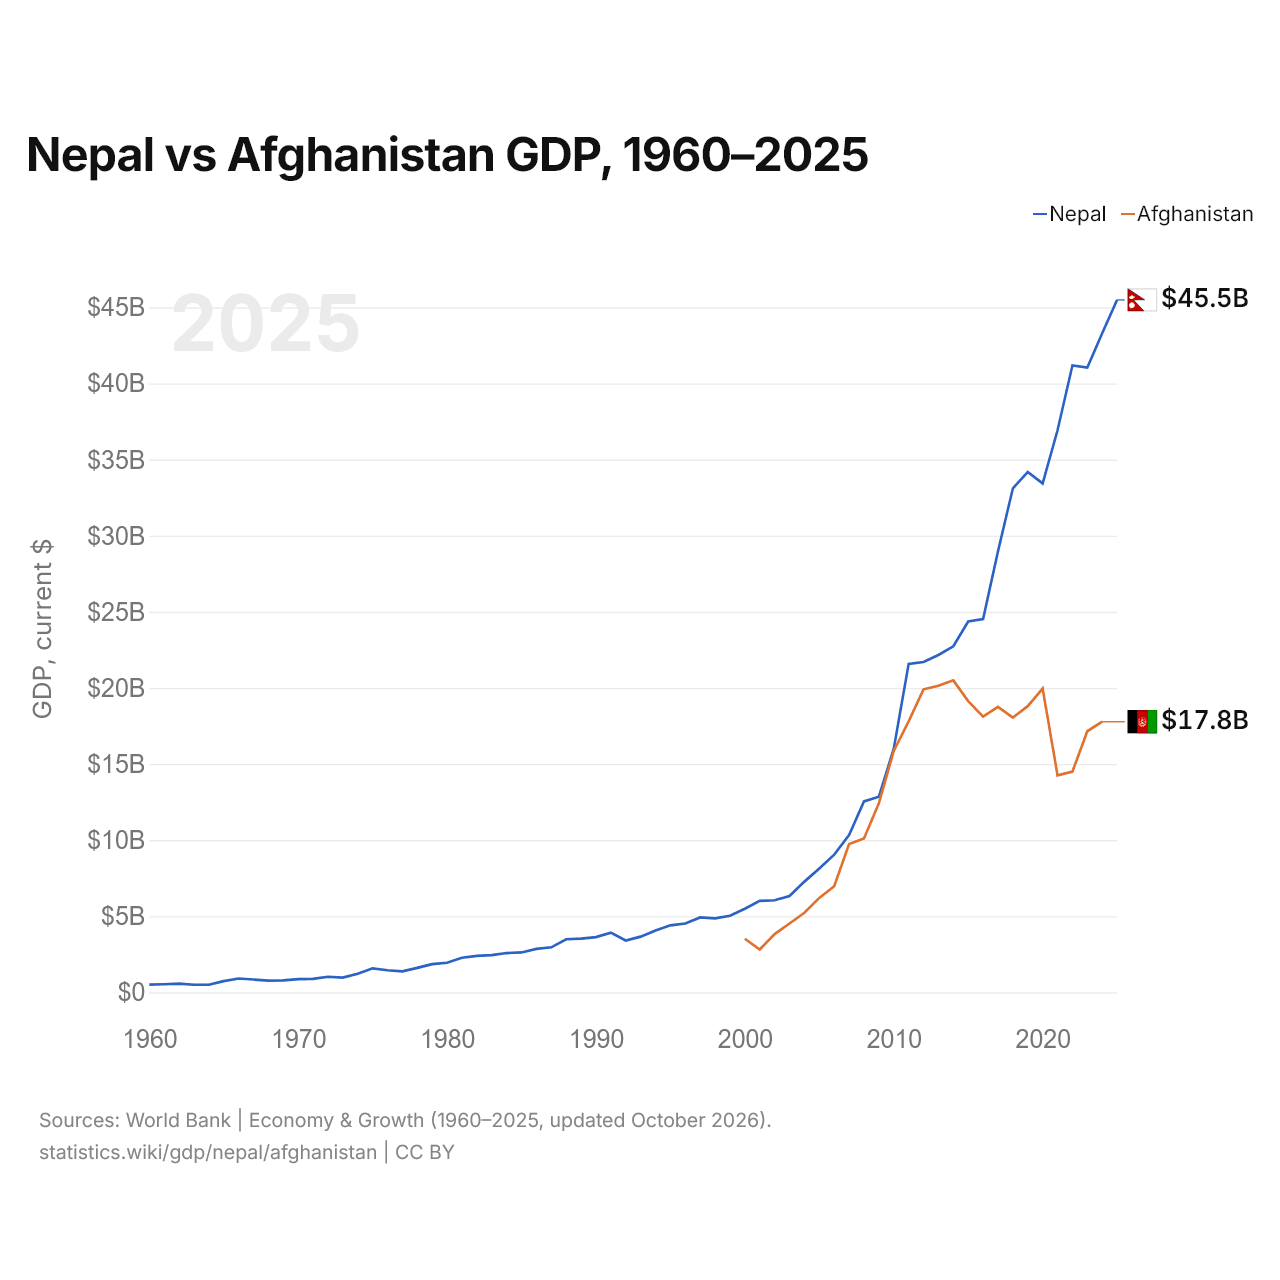
Le PIB du Népal (43,3 milliards de dollars US, 2024) était 2,4 fois celui de l'Afghanistan (17,8 milliards de dollars US, 2024). En 2014, l'écart était de 11 %. Depuis 2014, à prix constants de 2015, le PIB du Népal a progressé de 49,3 %, tandis que celui de l'Afghanistan a reculé de 15,3 %.
Depuis 2000, le PIB du Népal a chaque année été le plus élevé des deux ; en 2000, il était 1,6 fois celui de l'Afghanistan. Le PIB par habitant est de 1 536 $ US au Népal (2025) et de 417 $ US en Afghanistan (2024).
Népal vs Afghanistan : derniers chiffres du PIB
|
Népal
|
Afghanistan
|
|
|---|---|---|
| PIB, dollars US courants | 45,5 Md $US (2025) | 17,8 Md $US (2024) |
| Rang mondial | 102/197 | 139/197 |
| Part mondiale | 0,04 % | 0,02 % |
| PIB, dollars US constants de 2015 | 36,5 Md $US (2025) | 16,0 Md $US (2024) |
Comparer le PIB de 2 pays au choix
Sources :
- Banque mondiale | Économie et croissance (1960–2025, mis à jour en octobre 2026)
Creative Commons Attribution (CC BY) : vous pouvez copier, partager, adapter et réutiliser ce contenu, y compris à des fins commerciales, à condition de citer statistics.wiki et d’indiquer les modifications apportées. Les sources citées ci-dessus peuvent avoir leurs propres conditions de licence.