
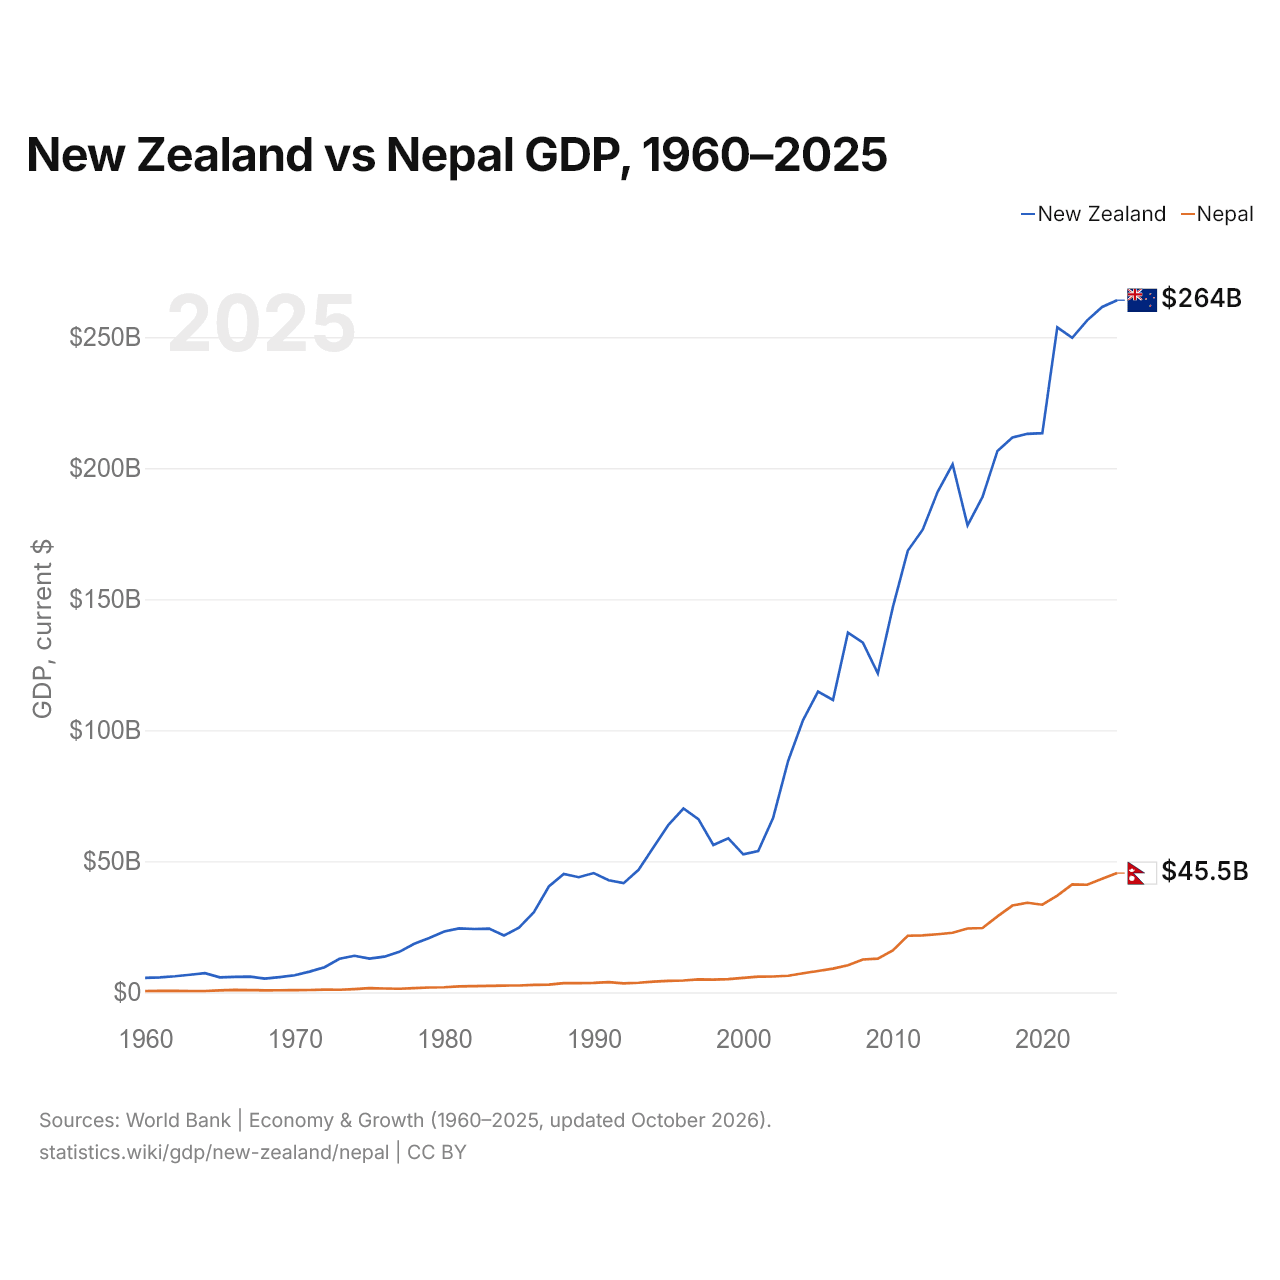
Nouvelle-Zélande vs Népal : PIB, 1960–2025
| Année | PIB, dollars US courants | |
|---|---|---|
 Nouvelle-Zélande |
 Népal |
|
| 2025 | 264 057 413 740 $ US | 45 489 810 283 $ US |
| 2024 | 261 497 198 364 $ US | 43 298 911 700 $ US |
| 2023 | 256 372 177 758 $ US | 41 049 329 851 $ US |
| 2022 | 249 723 029 451 $ US | 41 182 939 520 $ US |
| 2021 | 253 732 493 988 $ US | 36 924 841 394 $ US |
| 2020 | 213 318 129 989 $ US | 33 433 659 301 $ US |
| 2019 | 213 088 034 258 $ US | 34 186 180 699 $ US |
| 2018 | 211 726 161 989 $ US | 33 111 525 237 $ US |
| 2017 | 206 561 943 051 $ US | 28 971 588 940 $ US |
| 2016 | 188 980 351 891 $ US | 24 524 109 484 $ US |
| 2015 | 178 147 457 243 $ US | 24 360 801 287 $ US |
| 2014 | 201 435 445 068 $ US | 22 731 612 922 $ US |
| 2013 | 190 943 478 290 $ US | 22 162 204 925 $ US |
| 2012 | 176 508 049 114 $ US | 21 703 100 877 $ US |
| 2011 | 168 458 838 711 $ US | 21 573 872 421 $ US |
| 2010 | 146 887 902 524 $ US | 16 002 656 434 $ US |
| 2009 | 121 663 439 315 $ US | 12 854 985 464 $ US |
| 2008 | 133 437 126 590 $ US | 12 545 438 605 $ US |
| 2007 | 137 188 946 866 $ US | 10 325 618 017 $ US |
| 2006 | 111 538 810 713 $ US | 9 043 715 356 $ US |
| 2005 | 114 720 129 550 $ US | 8 130 258 378 $ US |
| 2004 | 103 905 210 084 $ US | 7 273 938 315 $ US |
| 2003 | 88 250 885 550 $ US | 6 330 473 097 $ US |
| 2002 | 66 627 729 311 $ US | 6 050 875 807 $ US |
| 2001 | 53 872 425 917 $ US | 6 007 055 042 $ US |
| 2000 | 52 623 281 957 $ US | 5 494 252 208 $ US |
| 1999 | 58 762 260 626 $ US | 5 033 642 384 $ US |
| 1998 | 56 227 169 851 $ US | 4 856 255 044 $ US |
| 1997 | 66 075 143 415 $ US | 4 918 691 917 $ US |
| 1996 | 70 140 835 299 $ US | 4 521 580 381 $ US |
| 1995 | 63 918 703 507 $ US | 4 401 104 418 $ US |
| 1994 | 55 314 732 279 $ US | 4 066 775 510 $ US |
| 1993 | 46 775 620 817 $ US | 3 660 041 667 $ US |
| 1992 | 41 649 829 860 $ US | 3 401 211 581 $ US |
| 1991 | 42 745 329 732 $ US | 3 921 476 085 $ US |
| 1990 | 45 495 129 385 $ US | 3 627 560 239 $ US |
| 1989 | 43 920 222 525 $ US | 3 525 225 787 $ US |
| 1988 | 45 176 811 594 $ US | 3 487 009 748 $ US |
| 1987 | 40 376 354 070 $ US | 2 957 255 380 $ US |
| 1986 | 30 604 668 357 $ US | 2 850 782 044 $ US |
| 1985 | 24 679 795 396 $ US | 2 619 913 956 $ US |
| 1984 | 21 665 975 319 $ US | 2 581 207 388 $ US |
| 1983 | 24 309 279 706 $ US | 2 447 174 803 $ US |
| 1982 | 24 164 603 059 $ US | 2 395 423 742 $ US |
| 1981 | 24 417 617 184 $ US | 2 275 583 317 $ US |
| 1980 | 23 244 547 385 $ US | 1 945 916 583 $ US |
| 1979 | 20 731 243 113 $ US | 1 851 250 008 $ US |
| 1978 | 18 530 518 395 $ US | 1 604 162 497 $ US |
| 1977 | 15 446 825 318 $ US | 1 382 400 000 $ US |
| 1976 | 13 604 832 424 $ US | 1 452 788 985 $ US |
| 1975 | 12 861 983 284 $ US | 1 575 789 254 $ US |
| 1974 | 13 940 981 798 $ US | 1 217 953 547 $ US |
| 1973 | 12 802 281 898 $ US | 972 101 725 $ US |
| 1972 | 9 567 331 065 $ US | 1 024 098 400 $ US |
| 1971 | 7 911 136 757 $ US | 882 765 472 $ US |
| 1970 | 6 495 605 331 $ US | 865 975 309 $ US |
| 1969 | 5 814 357 709 $ US | 788 641 965 $ US |
| 1968 | 5 228 045 415 $ US | 772 231 387 $ US |
| 1967 | 6 016 017 227 $ US | 841 974 025 $ US |
| 1966 | 5 917 437 693 $ US | 906 811 944 $ US |
| 1965 | 5 706 251 400 $ US | 735 267 082 $ US |
| 1964 | 7 340 766 415 $ US | 496 098 775 $ US |
| 1963 | 6 699 741 645 $ US | 496 947 904 $ US |
| 1962 | 6 133 158 532 $ US | 574 091 101 $ US |
| 1961 | 5 721 994 864 $ US | 531 959 562 $ US |
| 1960 | 5 536 098 360 $ US | 508 334 414 $ US |
En 2025, le PIB de la Nouvelle-Zélande (264 milliards de dollars US) était 5,8 fois celui du Népal (45,5 milliards de dollars US). En 2015, le rapport était de 7,3. De 2015 à 2025, à prix constants de 2015, le PIB de la Nouvelle-Zélande a progressé de 23,6 % et celui du Népal de 50,0 %.
Depuis 1960, le PIB de la Nouvelle-Zélande a chaque année été le plus élevé des deux ; en 1960, il était 11 fois celui du Népal. En 2025, le PIB par habitant était de 49 591 $ US en Nouvelle-Zélande et de 1 536 $ US au Népal, soit 32 fois plus élevé en Nouvelle-Zélande.
Nouvelle-Zélande vs Népal : derniers chiffres du PIB
|
Nouvelle-Zélande
|
Népal
|
|
|---|---|---|
| PIB, dollars US courants | 264 Md $US | 45,5 Md $US |
| Rang mondial | 53/197 | 102/197 |
| Part mondiale | 0,22 % | 0,04 % |
| PIB, dollars US constants de 2015 | 220 Md $US | 36,5 Md $US |
| Écart de PIB | 5,8× | 0,17× |
Comparer le PIB de 2 pays au choix
Sources :
- Banque mondiale | Économie et croissance (1960–2025, mis à jour en octobre 2026)
Creative Commons Attribution (CC BY) : vous pouvez copier, partager, adapter et réutiliser ce contenu, y compris à des fins commerciales, à condition de citer statistics.wiki et d’indiquer les modifications apportées. Les sources citées ci-dessus peuvent avoir leurs propres conditions de licence.