
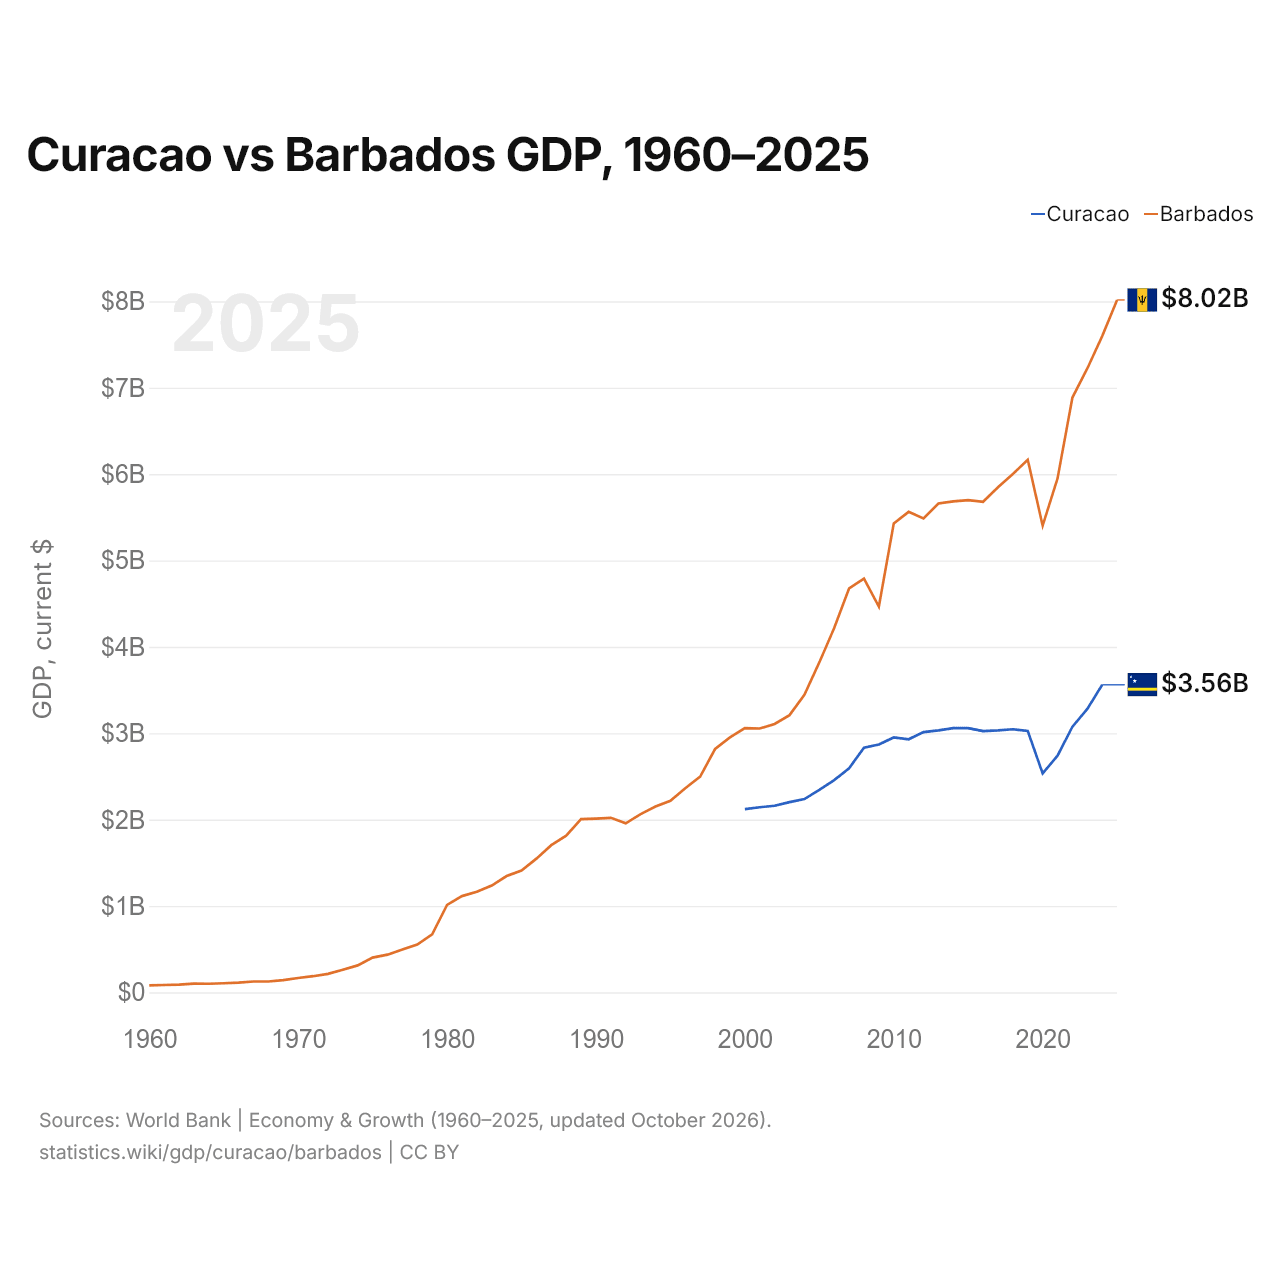
Curaçao vs Barbade : PIB, 1960–2025
| Année | PIB, dollars US courants | |
|---|---|---|
 Curaçao |
 Barbade |
|
| 2025 | - | 8 016 550 000 $ US |
| 2024 | 3 561 178 212 $ US | 7 597 571 450 $ US |
| 2023 | 3 281 419 330 $ US | 7 223 248 150 $ US |
| 2022 | 3 075 180 838 $ US | 6 886 644 900 $ US |
| 2021 | 2 739 594 358 $ US | 5 948 900 600 $ US |
| 2020 | 2 534 327 598 $ US | 5 403 246 950 $ US |
| 2019 | 3 026 124 134 $ US | 6 166 710 800 $ US |
| 2018 | 3 046 364 804 $ US | 6 001 101 550 $ US |
| 2017 | 3 033 433 240 $ US | 5 847 381 600 $ US |
| 2016 | 3 024 690 168 $ US | 5 679 029 450 $ US |
| 2015 | 3 058 779 218 $ US | 5 699 619 150 $ US |
| 2014 | 3 059 406 983 $ US | 5 684 901 000 $ US |
| 2013 | 3 033 568 603 $ US | 5 660 059 700 $ US |
| 2012 | 3 012 836 257 $ US | 5 486 500 500 $ US |
| 2011 | 2 930 092 235 $ US | 5 563 162 050 $ US |
| 2010 | 2 951 342 793 $ US | 5 428 683 250 $ US |
| 2009 | 2 869 153 184 $ US | 4 466 809 600 $ US |
| 2008 | 2 833 476 145 $ US | 4 790 410 400 $ US |
| 2007 | 2 593 831 508 $ US | 4 675 767 950 $ US |
| 2006 | 2 457 581 732 $ US | 4 217 323 400 $ US |
| 2005 | 2 344 637 263 $ US | 3 819 500 000 $ US |
| 2004 | 2 237 160 503 $ US | 3 444 500 000 $ US |
| 2003 | 2 202 117 374 $ US | 3 209 500 000 $ US |
| 2002 | 2 160 784 693 $ US | 3 106 500 000 $ US |
| 2001 | 2 143 450 726 $ US | 3 054 500 000 $ US |
| 2000 | 2 120 511 229 $ US | 3 059 500 000 $ US |
| 1999 | - | 2 951 822 205 $ US |
| 1998 | - | 2 817 083 478 $ US |
| 1997 | - | 2 498 384 130 $ US |
| 1996 | - | 2 363 645 403 $ US |
| 1995 | - | 2 216 974 096 $ US |
| 1994 | - | 2 151 344 901 $ US |
| 1993 | - | 2 063 342 117 $ US |
| 1992 | - | 1 957 000 000 $ US |
| 1991 | - | 2 020 583 702 $ US |
| 1990 | - | 2 012 131 457 $ US |
| 1989 | - | 2 006 165 167 $ US |
| 1988 | - | 1 812 757 918 $ US |
| 1987 | - | 1 704 370 308 $ US |
| 1986 | - | 1 547 755 183 $ US |
| 1985 | - | 1 409 536 121 $ US |
| 1984 | - | 1 346 890 071 $ US |
| 1983 | - | 1 236 016 507 $ US |
| 1982 | - | 1 163 923 830 $ US |
| 1981 | - | 1 114 204 743 $ US |
| 1980 | - | 1 012 280 615 $ US |
| 1979 | - | 670 362 452 $ US |
| 1978 | - | 552 883 707 $ US |
| 1977 | - | 495 097 668 $ US |
| 1976 | - | 435 911 269 $ US |
| 1975 | - | 402 178 605 $ US |
| 1974 | - | 311 804 630 $ US |
| 1973 | - | 260 767 828 $ US |
| 1972 | - | 213 725 217 $ US |
| 1971 | - | 186 826 503 $ US |
| 1970 | - | 166 210 203 $ US |
| 1969 | - | 141 393 142 $ US |
| 1968 | - | 125 733 669 $ US |
| 1967 | - | 125 554 009 $ US |
| 1966 | - | 113 195 123 $ US |
| 1965 | - | 105 021 997 $ US |
| 1964 | - | 99 252 731 $ US |
| 1963 | - | 99 893 761 $ US |
| 1962 | - | 88 782 583 $ US |
| 1961 | - | 85 363 759 $ US |
| 1960 | - | 80 021 847 $ US |
Le PIB de la Barbade (7,6 milliards de dollars US, 2024) était 2,1 fois celui de Curaçao (3,56 milliards de dollars US, 2024). En 2014, le rapport était de 1,9. Depuis 2014, à prix constants de 2015, le PIB de la Barbade a progressé de 10,3 %, tandis que celui de Curaçao a reculé de 7,6 %.
Depuis 2000, le PIB de la Barbade a chaque année été le plus élevé des deux ; en 2000, il était supérieur de 44 % à celui de Curaçao. Le PIB par habitant est de 22 833 $ US à Curaçao (2024) et de 28 365 $ US à la Barbade (2025).
Curaçao vs Barbade : derniers chiffres du PIB
|
Curaçao
|
Barbade
|
|
|---|---|---|
| PIB, dollars US courants | 3,56 Md $US (2024) | 8,02 Md $US (2025) |
| Rang mondial | 168/197 | 157/197 |
| Part mondiale | 0,003 % | 0,007 % |
| PIB, dollars US constants de 2015 | 2,81 Md $US (2024) | 6,50 Md $US (2025) |
Comparer le PIB de 2 pays au choix
Sources :
- Banque mondiale | Économie et croissance (1960–2025, mis à jour en octobre 2026)
Creative Commons Attribution (CC BY) : vous pouvez copier, partager, adapter et réutiliser ce contenu, y compris à des fins commerciales, à condition de citer statistics.wiki et d’indiquer les modifications apportées. Les sources citées ci-dessus peuvent avoir leurs propres conditions de licence.