
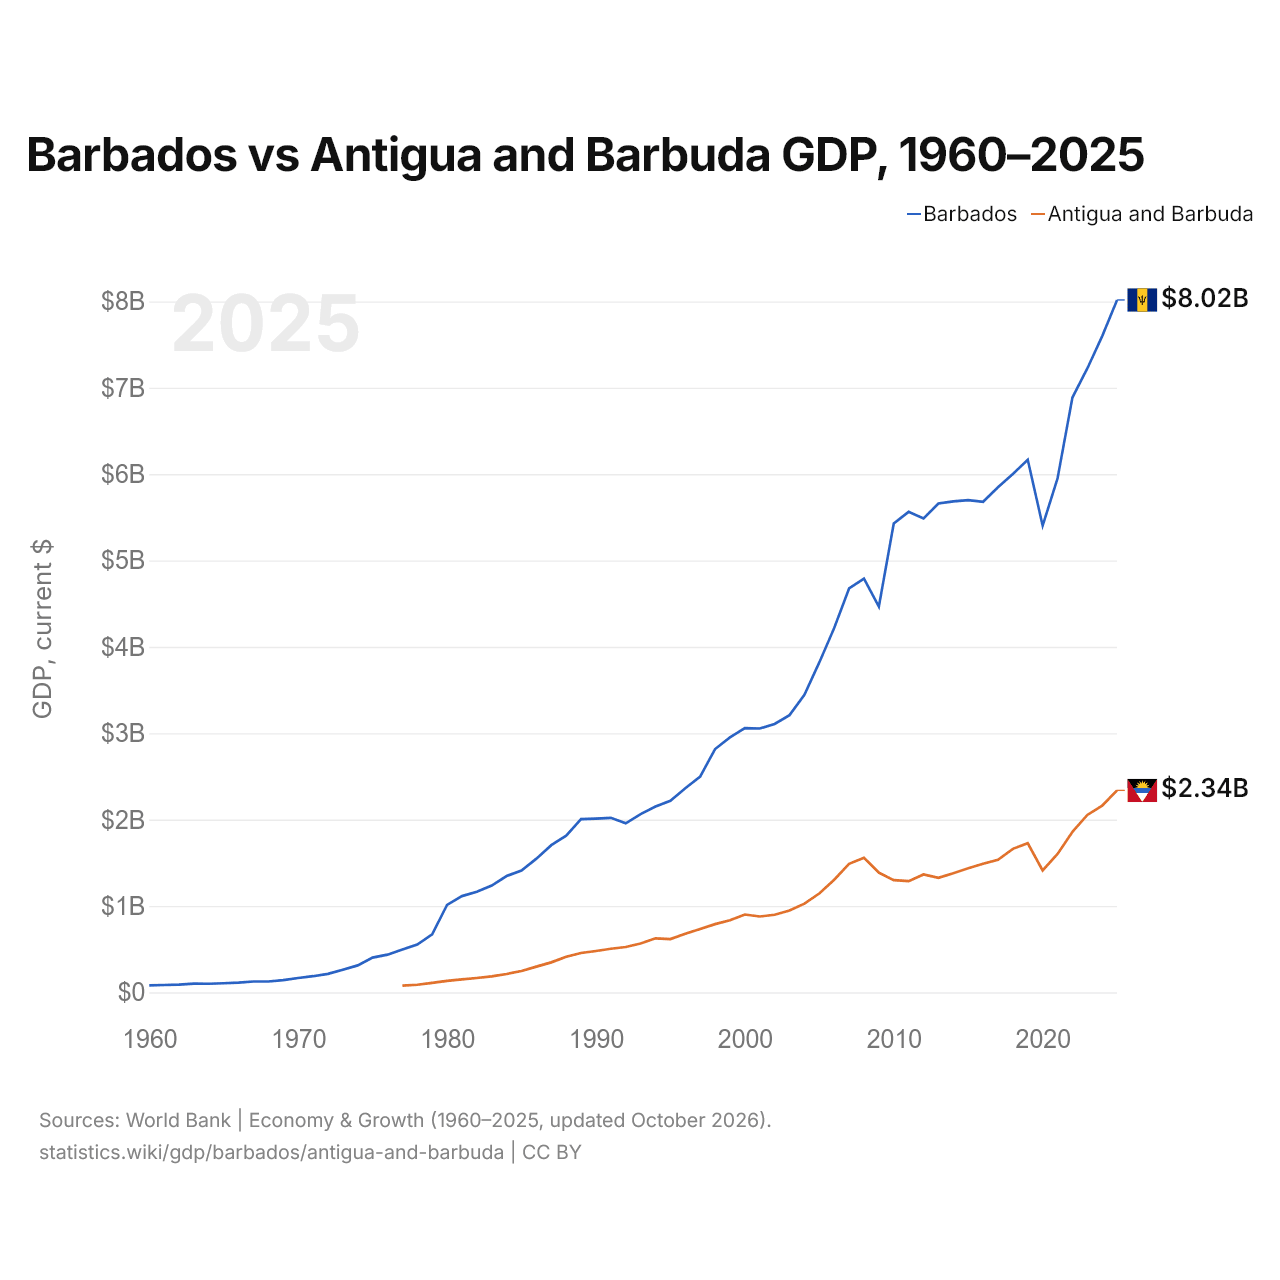
Barbade vs Antigua-et-Barbuda : PIB, 1960–2025
| Année | PIB, dollars US courants | |
|---|---|---|
 Barbade |
 Antigua-et-Barbuda |
|
| 2025 | 8 016 550 000 $ US | 2 338 196 296 $ US |
| 2024 | 7 597 571 450 $ US | 2 162 366 667 $ US |
| 2023 | 7 223 248 150 $ US | 2 054 096 296 $ US |
| 2022 | 6 886 644 900 $ US | 1 857 114 815 $ US |
| 2021 | 5 948 900 600 $ US | 1 602 125 926 $ US |
| 2020 | 5 403 246 950 $ US | 1 411 637 037 $ US |
| 2019 | 6 166 710 800 $ US | 1 726 448 148 $ US |
| 2018 | 6 001 101 550 $ US | 1 661 529 630 $ US |
| 2017 | 5 847 381 600 $ US | 1 534 855 556 $ US |
| 2016 | 5 679 029 450 $ US | 1 489 603 704 $ US |
| 2015 | 5 699 619 150 $ US | 1 437 485 185 $ US |
| 2014 | 5 684 901 000 $ US | 1 378 707 407 $ US |
| 2013 | 5 660 059 700 $ US | 1 325 496 296 $ US |
| 2012 | 5 486 500 500 $ US | 1 364 729 630 $ US |
| 2011 | 5 563 162 050 $ US | 1 287 359 259 $ US |
| 2010 | 5 428 683 250 $ US | 1 298 348 148 $ US |
| 2009 | 4 466 809 600 $ US | 1 386 518 519 $ US |
| 2008 | 4 790 410 400 $ US | 1 557 640 741 $ US |
| 2007 | 4 675 767 950 $ US | 1 487 381 481 $ US |
| 2006 | 4 217 323 400 $ US | 1 303 674 074 $ US |
| 2005 | 3 819 500 000 $ US | 1 143 896 296 $ US |
| 2004 | 3 444 500 000 $ US | 1 026 329 630 $ US |
| 2003 | 3 209 500 000 $ US | 948 100 000 $ US |
| 2002 | 3 106 500 000 $ US | 898 092 593 $ US |
| 2001 | 3 054 500 000 $ US | 877 774 074 $ US |
| 2000 | 3 059 500 000 $ US | 901 003 704 $ US |
| 1999 | 2 951 822 205 $ US | 835 544 444 $ US |
| 1998 | 2 817 083 478 $ US | 789 788 889 $ US |
| 1997 | 2 498 384 130 $ US | 734 422 222 $ US |
| 1996 | 2 363 645 403 $ US | 679 140 741 $ US |
| 1995 | 2 216 974 096 $ US | 616 051 852 $ US |
| 1994 | 2 151 344 901 $ US | 625 081 481 $ US |
| 1993 | 2 063 342 117 $ US | 565 662 963 $ US |
| 1992 | 1 957 000 000 $ US | 525 133 333 $ US |
| 1991 | 2 020 583 702 $ US | 504 337 037 $ US |
| 1990 | 2 012 131 457 $ US | 478 718 519 $ US |
| 1989 | 2 006 165 167 $ US | 455 174 074 $ US |
| 1988 | 1 812 757 918 $ US | 411 396 296 $ US |
| 1987 | 1 704 370 308 $ US | 346 866 667 $ US |
| 1986 | 1 547 755 183 $ US | 297 562 963 $ US |
| 1985 | 1 409 536 121 $ US | 246 370 370 $ US |
| 1984 | 1 346 890 071 $ US | 212 214 815 $ US |
| 1983 | 1 236 016 507 $ US | 184 866 667 $ US |
| 1982 | 1 163 923 830 $ US | 166 444 444 $ US |
| 1981 | 1 114 204 743 $ US | 149 388 889 $ US |
| 1980 | 1 012 280 615 $ US | 132 451 852 $ US |
| 1979 | 670 362 452 $ US | 109 596 296 $ US |
| 1978 | 552 883 707 $ US | 88 040 741 $ US |
| 1977 | 495 097 668 $ US | 77 507 407 $ US |
| 1976 | 435 911 269 $ US | - |
| 1975 | 402 178 605 $ US | - |
| 1974 | 311 804 630 $ US | - |
| 1973 | 260 767 828 $ US | - |
| 1972 | 213 725 217 $ US | - |
| 1971 | 186 826 503 $ US | - |
| 1970 | 166 210 203 $ US | - |
| 1969 | 141 393 142 $ US | - |
| 1968 | 125 733 669 $ US | - |
| 1967 | 125 554 009 $ US | - |
| 1966 | 113 195 123 $ US | - |
| 1965 | 105 021 997 $ US | - |
| 1964 | 99 252 731 $ US | - |
| 1963 | 99 893 761 $ US | - |
| 1962 | 88 782 583 $ US | - |
| 1961 | 85 363 759 $ US | - |
| 1960 | 80 021 847 $ US | - |
En 2025, le PIB de la Barbade (8,02 milliards de dollars US) était 3,4 fois celui d'Antigua-et-Barbuda (2,34 milliards de dollars US). En 2015, le rapport était de 4,0. De 2015 à 2025, à prix constants de 2015, le PIB de la Barbade a progressé de 14,1 % et celui d'Antigua-et-Barbuda de 25,4 %.
Depuis 1977, le PIB de la Barbade a chaque année été le plus élevé des deux ; en 1977, il était 6,4 fois celui d'Antigua-et-Barbuda. En 2025, le PIB par habitant était de 28 365 $ US à la Barbade et de 24 819 $ US à Antigua-et-Barbuda, soit 14 % de plus à la Barbade.
Barbade vs Antigua-et-Barbuda : derniers chiffres du PIB
|
Barbade
|
Antigua-et-Barbuda
|
|
|---|---|---|
| PIB, dollars US courants | 8,02 Md $US | 2,34 Md $US |
| Rang mondial | 157/197 | 178/197 |
| Part mondiale | 0,007 % | 0,002 % |
| PIB, dollars US constants de 2015 | 6,50 Md $US | 1,80 Md $US |
| Écart de PIB | 3,4× | 0,29× |
Comparer le PIB de 2 pays au choix
Sources :
- Banque mondiale | Économie et croissance (1960–2025, mis à jour en octobre 2026)
Creative Commons Attribution (CC BY) : vous pouvez copier, partager, adapter et réutiliser ce contenu, y compris à des fins commerciales, à condition de citer statistics.wiki et d’indiquer les modifications apportées. Les sources citées ci-dessus peuvent avoir leurs propres conditions de licence.