
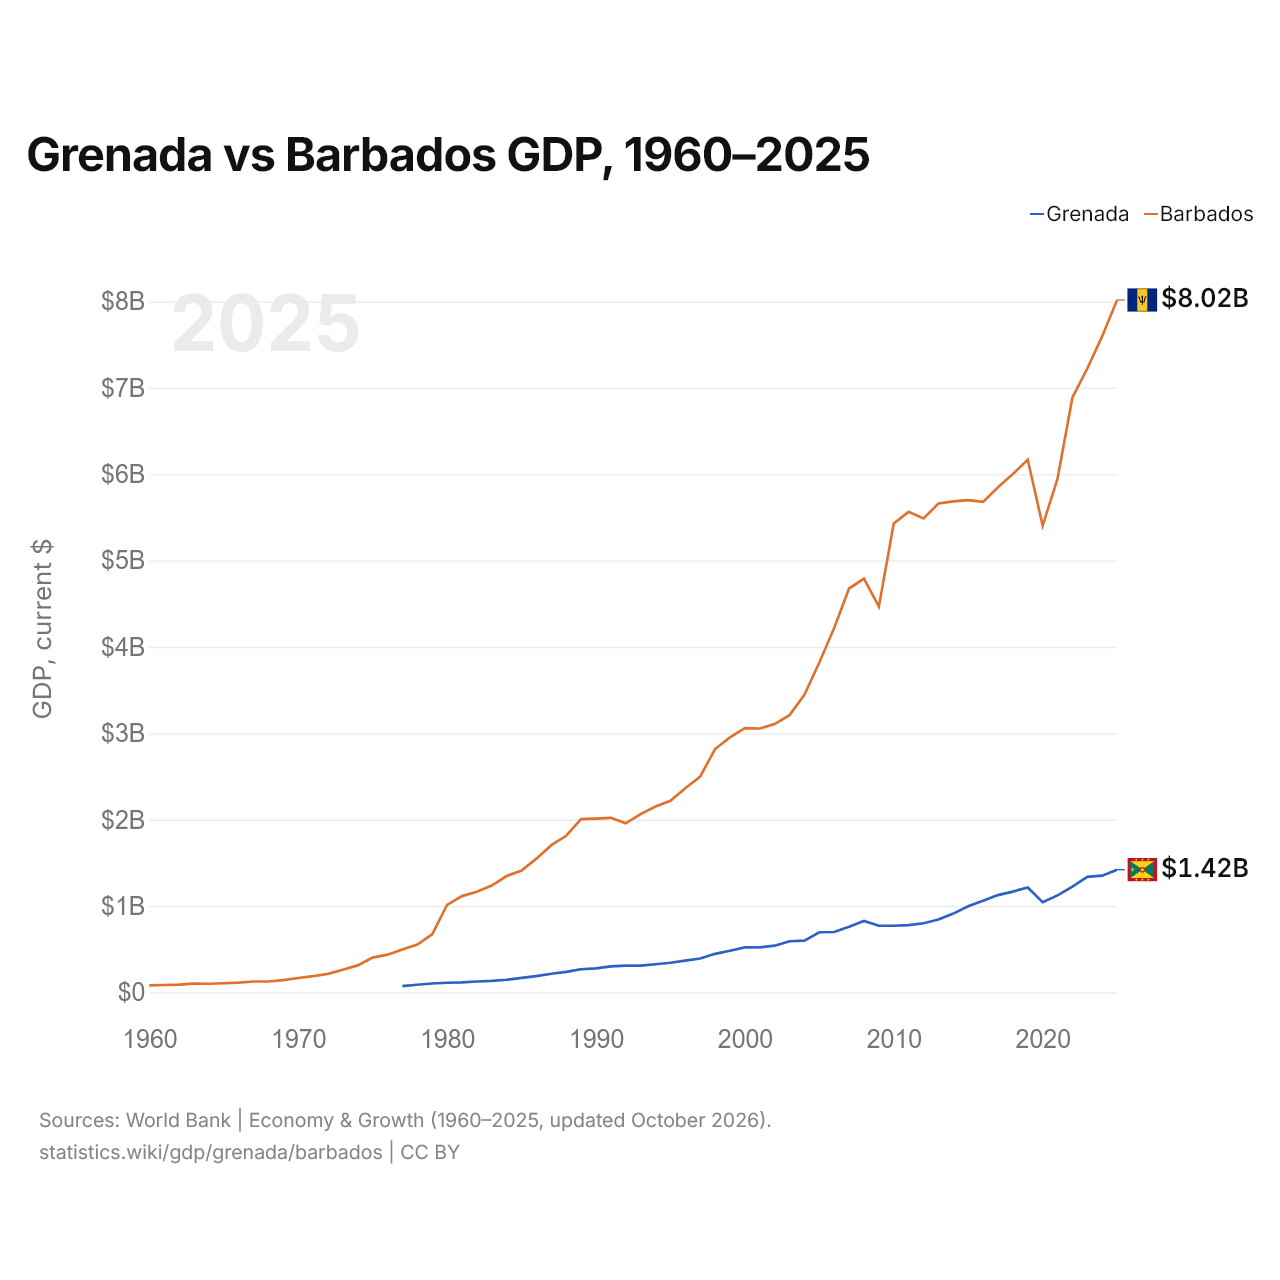
Grenade vs Barbade : PIB, 1960–2025
| Année | PIB, dollars US courants | |
|---|---|---|
 Grenade |
 Barbade |
|
| 2025 | 1 420 173 229 $ US | 8 016 550 000 $ US |
| 2024 | 1 351 270 370 $ US | 7 597 571 450 $ US |
| 2023 | 1 336 418 519 $ US | 7 223 248 150 $ US |
| 2022 | 1 224 007 407 $ US | 6 886 644 900 $ US |
| 2021 | 1 122 222 222 $ US | 5 948 900 600 $ US |
| 2020 | 1 043 411 111 $ US | 5 403 246 950 $ US |
| 2019 | 1 213 485 185 $ US | 6 166 710 800 $ US |
| 2018 | 1 166 514 815 $ US | 6 001 101 550 $ US |
| 2017 | 1 125 685 185 $ US | 5 847 381 600 $ US |
| 2016 | 1 061 640 741 $ US | 5 679 029 450 $ US |
| 2015 | 997 007 407 $ US | 5 699 619 150 $ US |
| 2014 | 911 496 296 $ US | 5 684 901 000 $ US |
| 2013 | 842 618 519 $ US | 5 660 059 700 $ US |
| 2012 | 799 881 481 $ US | 5 486 500 500 $ US |
| 2011 | 778 655 556 $ US | 5 563 162 050 $ US |
| 2010 | 771 014 815 $ US | 5 428 683 250 $ US |
| 2009 | 771 275 556 $ US | 4 466 809 600 $ US |
| 2008 | 825 976 037 $ US | 4 790 410 400 $ US |
| 2007 | 758 683 593 $ US | 4 675 767 950 $ US |
| 2006 | 698 700 667 $ US | 4 217 323 400 $ US |
| 2005 | 695 555 556 $ US | 3 819 500 000 $ US |
| 2004 | 599 118 593 $ US | 3 444 500 000 $ US |
| 2003 | 591 018 407 $ US | 3 209 500 000 $ US |
| 2002 | 540 336 926 $ US | 3 106 500 000 $ US |
| 2001 | 520 444 185 $ US | 3 054 500 000 $ US |
| 2000 | 520 044 370 $ US | 3 059 500 000 $ US |
| 1999 | 482 009 370 $ US | 2 951 822 205 $ US |
| 1998 | 445 903 593 $ US | 2 817 083 478 $ US |
| 1997 | 392 190 593 $ US | 2 498 384 130 $ US |
| 1996 | 366 911 444 $ US | 2 363 645 403 $ US |
| 1995 | 342 172 519 $ US | 2 216 974 096 $ US |
| 1994 | 325 111 815 $ US | 2 151 344 901 $ US |
| 1993 | 309 812 185 $ US | 2 063 342 117 $ US |
| 1992 | 310 160 444 $ US | 1 957 000 000 $ US |
| 1991 | 300 757 889 $ US | 2 020 583 702 $ US |
| 1990 | 278 098 763 $ US | 2 012 131 457 $ US |
| 1989 | 267 327 642 $ US | 2 006 165 167 $ US |
| 1988 | 236 357 524 $ US | 1 812 757 918 $ US |
| 1987 | 215 009 570 $ US | 1 704 370 308 $ US |
| 1986 | 187 589 523 $ US | 1 547 755 183 $ US |
| 1985 | 167 728 455 $ US | 1 409 536 121 $ US |
| 1984 | 145 533 311 $ US | 1 346 890 071 $ US |
| 1983 | 131 803 552 $ US | 1 236 016 507 $ US |
| 1982 | 125 435 590 $ US | 1 163 923 830 $ US |
| 1981 | 115 651 919 $ US | 1 114 204 743 $ US |
| 1980 | 110 900 457 $ US | 1 012 280 615 $ US |
| 1979 | 102 244 362 $ US | 670 362 452 $ US |
| 1978 | 88 322 386 $ US | 552 883 707 $ US |
| 1977 | 71 494 495 $ US | 495 097 668 $ US |
| 1976 | - | 435 911 269 $ US |
| 1975 | - | 402 178 605 $ US |
| 1974 | - | 311 804 630 $ US |
| 1973 | - | 260 767 828 $ US |
| 1972 | - | 213 725 217 $ US |
| 1971 | - | 186 826 503 $ US |
| 1970 | - | 166 210 203 $ US |
| 1969 | - | 141 393 142 $ US |
| 1968 | - | 125 733 669 $ US |
| 1967 | - | 125 554 009 $ US |
| 1966 | - | 113 195 123 $ US |
| 1965 | - | 105 021 997 $ US |
| 1964 | - | 99 252 731 $ US |
| 1963 | - | 99 893 761 $ US |
| 1962 | - | 88 782 583 $ US |
| 1961 | - | 85 363 759 $ US |
| 1960 | - | 80 021 847 $ US |
En 2025, le PIB de la Barbade (8,02 milliards de dollars US) était 5,6 fois celui de la Grenade (1,42 milliard de dollars US). En 2015, le rapport était de 5,7. De 2015 à 2025, à prix constants de 2015, le PIB de la Barbade a progressé de 14,1 % et celui de la Grenade de 23,3 %.
Depuis 1977, le PIB de la Barbade a chaque année été le plus élevé des deux ; en 1977, il était 6,9 fois celui de la Grenade. En 2025, le PIB par habitant était de 12 107 $ US à la Grenade et de 28 365 $ US à la Barbade, soit 2,3 fois plus élevé à la Barbade.
Grenade vs Barbade : derniers chiffres du PIB
|
Grenade
|
Barbade
|
|
|---|---|---|
| PIB, dollars US courants | 1,42 Md $US | 8,02 Md $US |
| Rang mondial | 184/197 | 157/197 |
| Part mondiale | 0,001 % | 0,007 % |
| PIB, dollars US constants de 2015 | 1,23 Md $US | 6,50 Md $US |
| Écart de PIB | 0,18× | 5,6× |
Comparer le PIB de 2 pays au choix
Sources :
- Banque mondiale | Économie et croissance (1960–2025, mis à jour en octobre 2026)
Creative Commons Attribution (CC BY) : vous pouvez copier, partager, adapter et réutiliser ce contenu, y compris à des fins commerciales, à condition de citer statistics.wiki et d’indiquer les modifications apportées. Les sources citées ci-dessus peuvent avoir leurs propres conditions de licence.