
Malte vs Curaçao : PIB, 1970–2025
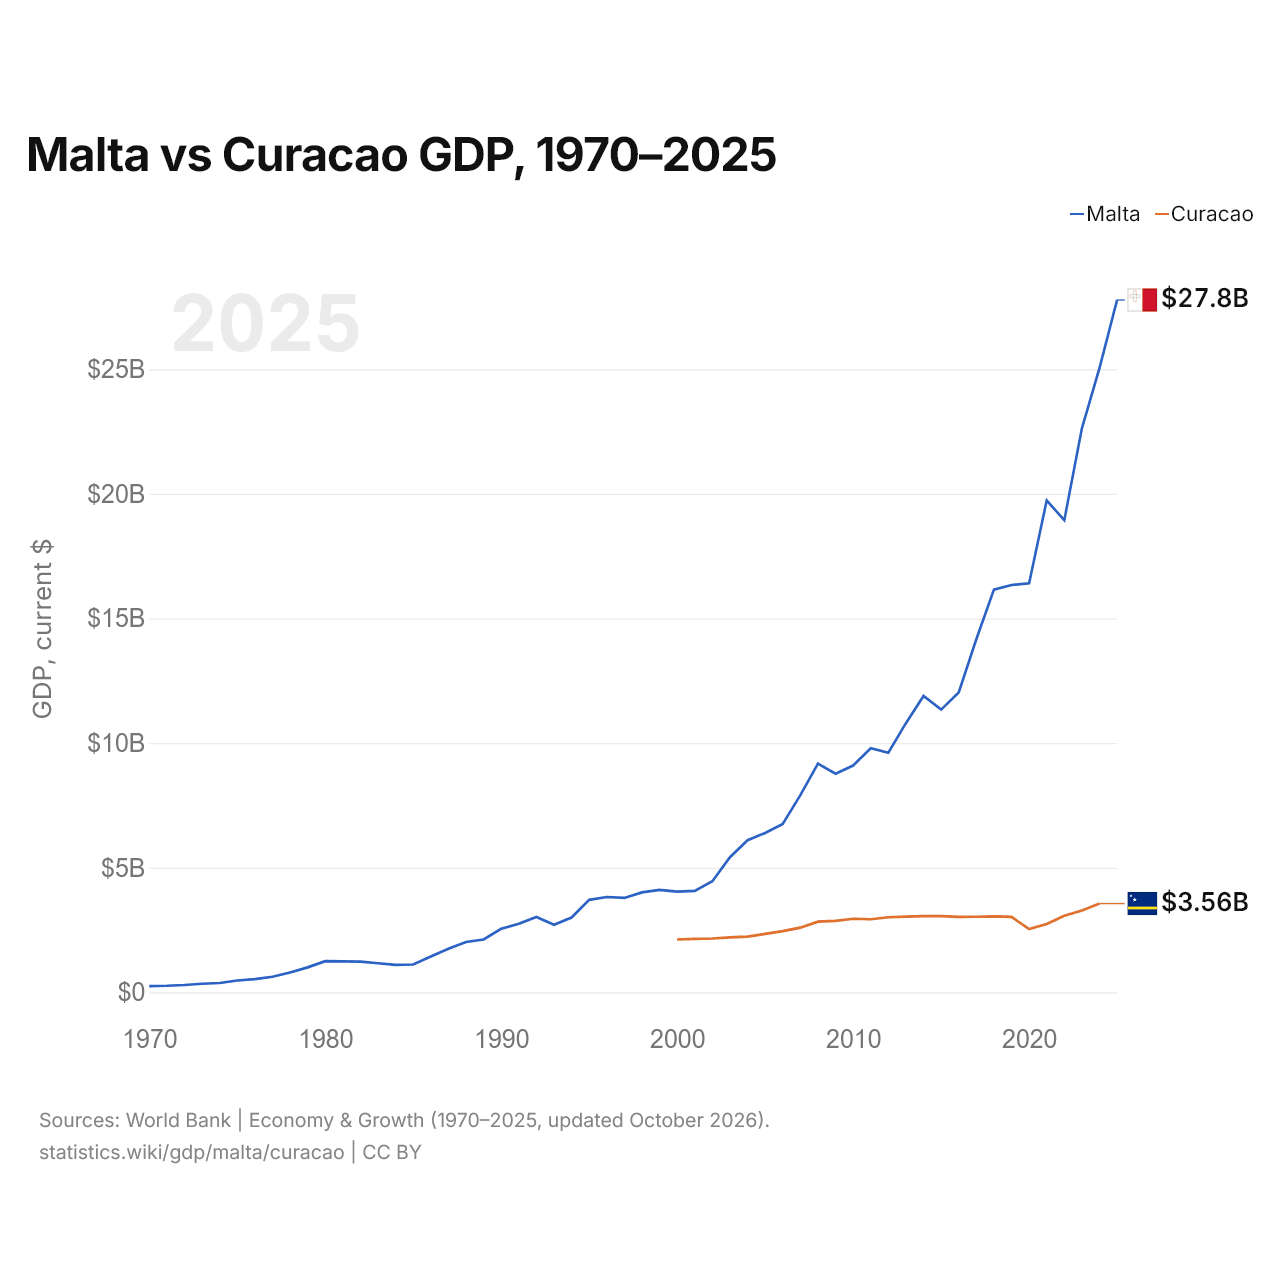
| Année | PIB, dollars US courants | |
|---|---|---|
 Malte |
 Curaçao |
|
| 2025 | 27 771 821 561 $ US | - |
| 2024 | 25 042 712 191 $ US | 3 561 178 212 $ US |
| 2023 | 22 625 329 776 $ US | 3 281 419 330 $ US |
| 2022 | 18 938 869 147 $ US | 3 075 180 838 $ US |
| 2021 | 19 730 119 031 $ US | 2 739 594 358 $ US |
| 2020 | 16 404 655 808 $ US | 2 534 327 598 $ US |
| 2019 | 16 337 788 881 $ US | 3 026 124 134 $ US |
| 2018 | 16 153 785 817 $ US | 3 046 364 804 $ US |
| 2017 | 14 161 374 599 $ US | 3 033 433 240 $ US |
| 2016 | 12 025 777 078 $ US | 3 024 690 168 $ US |
| 2015 | 11 340 789 706 $ US | 3 058 779 218 $ US |
| 2014 | 11 888 029 752 $ US | 3 059 406 983 $ US |
| 2013 | 10 796 780 874 $ US | 3 033 568 603 $ US |
| 2012 | 9 609 530 619 $ US | 3 012 836 257 $ US |
| 2011 | 9 789 363 086 $ US | 2 930 092 235 $ US |
| 2010 | 9 097 044 301 $ US | 2 951 342 793 $ US |
| 2009 | 8 769 897 418 $ US | 2 869 153 184 $ US |
| 2008 | 9 172 399 573 $ US | 2 833 476 145 $ US |
| 2007 | 7 908 412 374 $ US | 2 593 831 508 $ US |
| 2006 | 6 749 838 862 $ US | 2 457 581 732 $ US |
| 2005 | 6 393 234 965 $ US | 2 344 637 263 $ US |
| 2004 | 6 104 141 501 $ US | 2 237 160 503 $ US |
| 2003 | 5 418 315 225 $ US | 2 202 117 374 $ US |
| 2002 | 4 455 127 398 $ US | 2 160 784 693 $ US |
| 2001 | 4 070 867 153 $ US | 2 143 450 726 $ US |
| 2000 | 4 036 809 767 $ US | 2 120 511 229 $ US |
| 1999 | 4 111 857 836 $ US | - |
| 1998 | 4 010 111 652 $ US | - |
| 1997 | 3 787 023 655 $ US | - |
| 1996 | 3 822 547 151 $ US | - |
| 1995 | 3 709 396 089 $ US | - |
| 1994 | 2 998 505 428 $ US | - |
| 1993 | 2 709 193 538 $ US | - |
| 1992 | 3 021 942 759 $ US | - |
| 1991 | 2 750 216 747 $ US | - |
| 1990 | 2 547 328 748 $ US | - |
| 1989 | 2 118 655 677 $ US | - |
| 1988 | 2 019 503 068 $ US | - |
| 1987 | 1 751 293 461 $ US | - |
| 1986 | 1 435 038 441 $ US | - |
| 1985 | 1 117 797 439 $ US | - |
| 1984 | 1 101 807 023 $ US | - |
| 1983 | 1 165 729 707 $ US | - |
| 1982 | 1 234 474 404 $ US | - |
| 1981 | 1 243 509 394 $ US | - |
| 1980 | 1 250 198 601 $ US | - |
| 1979 | 1 001 288 847 $ US | - |
| 1978 | 793 673 402 $ US | - |
| 1977 | 625 563 171 $ US | - |
| 1976 | 527 936 989 $ US | - |
| 1975 | 474 618 321 $ US | - |
| 1974 | 376 081 124 $ US | - |
| 1973 | 345 616 106 $ US | - |
| 1972 | 295 106 628 $ US | - |
| 1971 | 264 578 485 $ US | - |
| 1970 | 250 728 796 $ US | - |
Le PIB de Malte (25 milliards de dollars US, 2024) était 7,0 fois celui de Curaçao (3,56 milliards de dollars US, 2024). En 2014, le rapport était de 3,9. Depuis 2014, à prix constants de 2015, le PIB de Malte a progressé de 89,7 %, tandis que celui de Curaçao a reculé de 7,6 %.
Depuis 2000, le PIB de Malte a chaque année été le plus élevé des deux ; en 2000, il était 1,9 fois celui de Curaçao. Le PIB par habitant est de 47 907 $ US à Malte (2025) et de 22 833 $ US à Curaçao (2024).
Malte vs Curaçao : derniers chiffres du PIB
|
Malte
|
Curaçao
|
|
|---|---|---|
| PIB, dollars US courants | 27,8 Md $US (2025) | 3,56 Md $US (2024) |
| Rang mondial | 118/197 | 168/197 |
| Part mondiale | 0,02 % | 0,003 % |
| PIB, dollars US constants de 2015 | 20,4 Md $US (2025) | 2,81 Md $US (2024) |
Comparer le PIB de 2 pays au choix
Sources :
- Banque mondiale | Économie et croissance (1970–2025, mis à jour en octobre 2026)
Creative Commons Attribution (CC BY) : vous pouvez copier, partager, adapter et réutiliser ce contenu, y compris à des fins commerciales, à condition de citer statistics.wiki et d’indiquer les modifications apportées. Les sources citées ci-dessus peuvent avoir leurs propres conditions de licence.