
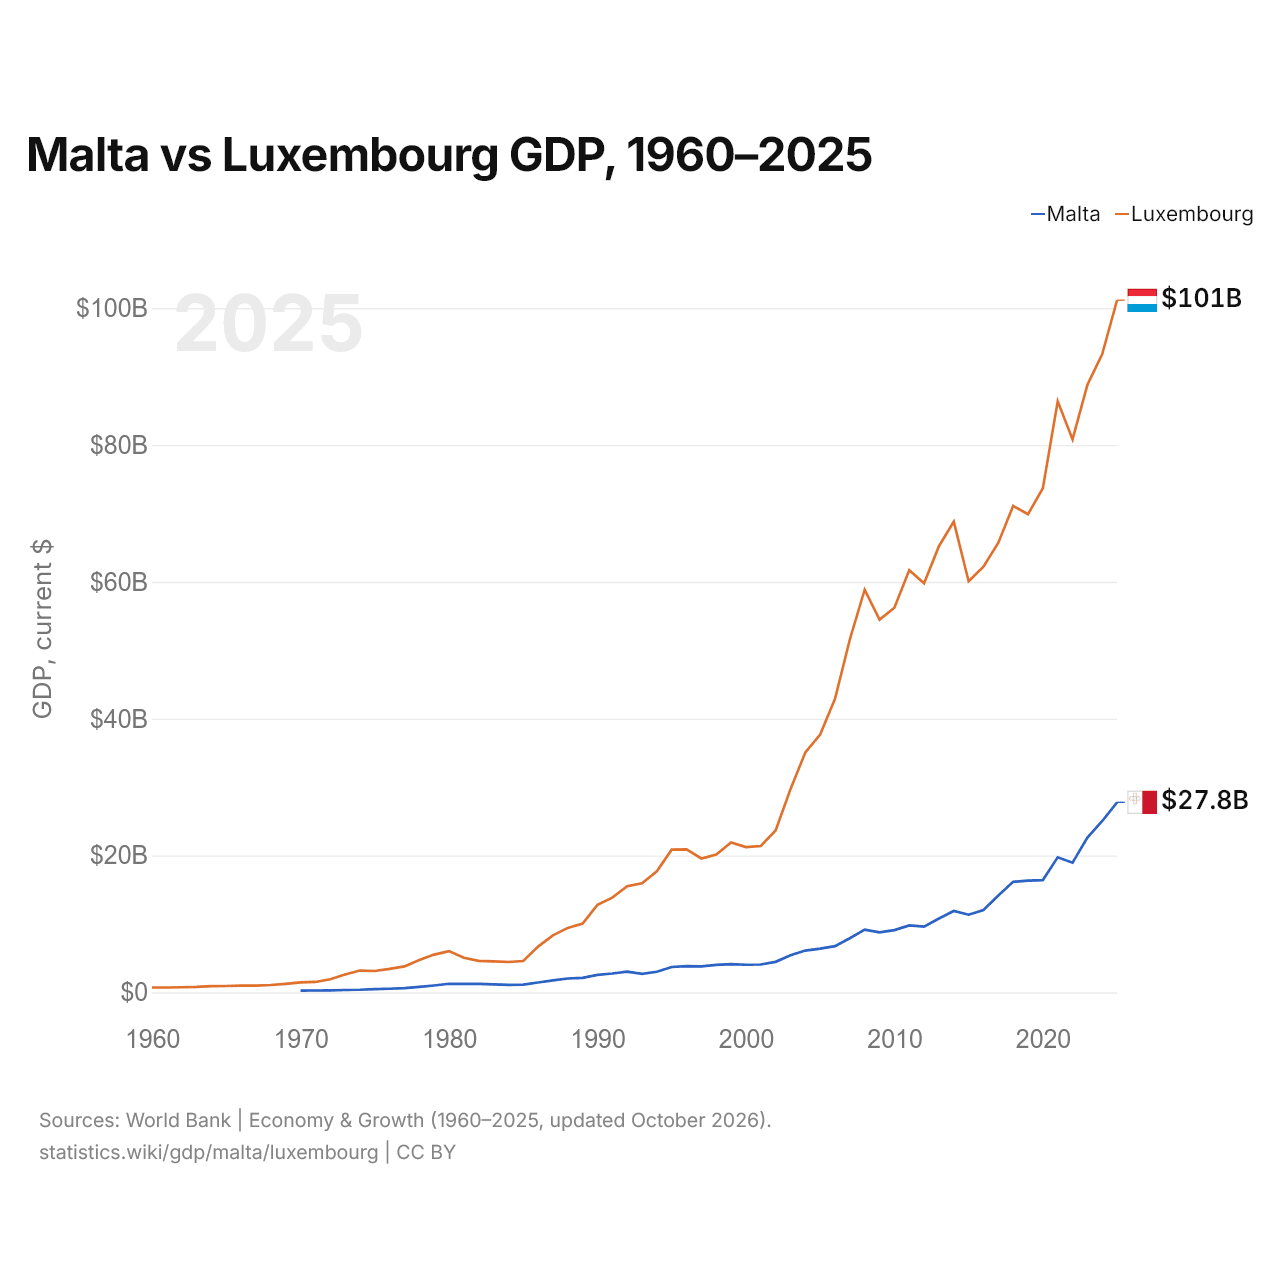
Malte vs Luxembourg : PIB, 1960–2025
| Année | PIB, dollars US courants | |
|---|---|---|
 Malte |
 Luxembourg |
|
| 2025 | 27 771 821 561 $ US | 101 157 829 491 $ US |
| 2024 | 25 042 712 191 $ US | 93 279 851 863 $ US |
| 2023 | 22 625 329 776 $ US | 88 788 881 539 $ US |
| 2022 | 18 938 869 147 $ US | 80 801 680 397 $ US |
| 2021 | 19 730 119 031 $ US | 86 386 759 695 $ US |
| 2020 | 16 404 655 808 $ US | 73 670 782 100 $ US |
| 2019 | 16 337 788 881 $ US | 69 872 035 114 $ US |
| 2018 | 16 153 785 817 $ US | 71 085 623 495 $ US |
| 2017 | 14 161 374 599 $ US | 65 712 180 343 $ US |
| 2016 | 12 025 777 078 $ US | 62 216 885 436 $ US |
| 2015 | 11 340 789 706 $ US | 60 071 584 216 $ US |
| 2014 | 11 888 029 752 $ US | 68 804 814 555 $ US |
| 2013 | 10 796 780 874 $ US | 65 203 276 467 $ US |
| 2012 | 9 609 530 619 $ US | 59 776 383 527 $ US |
| 2011 | 9 789 363 086 $ US | 61 696 281 326 $ US |
| 2010 | 9 097 044 301 $ US | 56 213 985 987 $ US |
| 2009 | 8 769 897 418 $ US | 54 467 289 898 $ US |
| 2008 | 9 172 399 573 $ US | 58 844 277 702 $ US |
| 2007 | 7 908 412 374 $ US | 51 587 401 416 $ US |
| 2006 | 6 749 838 862 $ US | 42 910 153 830 $ US |
| 2005 | 6 393 234 965 $ US | 37 672 311 223 $ US |
| 2004 | 6 104 141 501 $ US | 35 064 843 793 $ US |
| 2003 | 5 418 315 225 $ US | 29 667 268 248 $ US |
| 2002 | 4 455 127 398 $ US | 23 649 832 387 $ US |
| 2001 | 4 070 867 153 $ US | 21 387 550 720 $ US |
| 2000 | 4 036 809 767 $ US | 21 230 200 538 $ US |
| 1999 | 4 111 857 836 $ US | 21 899 317 599 $ US |
| 1998 | 4 010 111 652 $ US | 20 150 055 568 $ US |
| 1997 | 3 787 023 655 $ US | 19 563 836 265 $ US |
| 1996 | 3 822 547 151 $ US | 20 895 314 658 $ US |
| 1995 | 3 709 396 089 $ US | 20 853 093 870 $ US |
| 1994 | 2 998 505 428 $ US | 17 701 798 891 $ US |
| 1993 | 2 709 193 538 $ US | 15 925 521 222 $ US |
| 1992 | 3 021 942 759 $ US | 15 518 702 635 $ US |
| 1991 | 2 750 216 747 $ US | 13 834 219 728 $ US |
| 1990 | 2 547 328 748 $ US | 12 778 792 854 $ US |
| 1989 | 2 118 655 677 $ US | 10 037 674 038 $ US |
| 1988 | 2 019 503 068 $ US | 9 418 167 855 $ US |
| 1987 | 1 751 293 461 $ US | 8 320 902 215 $ US |
| 1986 | 1 435 038 441 $ US | 6 685 595 088 $ US |
| 1985 | 1 117 797 439 $ US | 4 577 211 767 $ US |
| 1984 | 1 101 807 023 $ US | 4 438 435 493 $ US |
| 1983 | 1 165 729 707 $ US | 4 524 217 751 $ US |
| 1982 | 1 234 474 404 $ US | 4 602 316 793 $ US |
| 1981 | 1 243 509 394 $ US | 5 053 665 797 $ US |
| 1980 | 1 250 198 601 $ US | 6 019 805 490 $ US |
| 1979 | 1 001 288 847 $ US | 5 516 982 664 $ US |
| 1978 | 793 673 402 $ US | 4 718 539 772 $ US |
| 1977 | 625 563 171 $ US | 3 789 321 328 $ US |
| 1976 | 527 936 989 $ US | 3 423 586 207 $ US |
| 1975 | 474 618 321 $ US | 3 123 333 333 $ US |
| 1974 | 376 081 124 $ US | 3 183 637 117 $ US |
| 1973 | 345 616 106 $ US | 2 609 875 802 $ US |
| 1972 | 295 106 628 $ US | 1 901 697 370 $ US |
| 1971 | 264 578 485 $ US | 1 518 773 421 $ US |
| 1970 | 250 728 796 $ US | 1 457 768 455 $ US |
| 1969 | - | 1 245 432 991 $ US |
| 1968 | - | 1 075 561 623 $ US |
| 1967 | - | 983 052 315 $ US |
| 1966 | - | 976 717 015 $ US |
| 1965 | - | 929 477 285 $ US |
| 1964 | - | 910 877 686 $ US |
| 1963 | - | 797 902 154 $ US |
| 1962 | - | 747 846 862 $ US |
| 1961 | - | 710 163 719 $ US |
| 1960 | - | 709 941 874 $ US |
En 2025, le PIB du Luxembourg (101 milliards de dollars US) était 3,6 fois celui de Malte (27,8 milliards de dollars US). En 2015, le rapport était de 5,3. De 2015 à 2025, à prix constants de 2015, le PIB du Luxembourg a progressé de 18,1 % et celui de Malte de 79,9 %.
Depuis 1970, le PIB du Luxembourg a chaque année été le plus élevé des deux ; en 1970, il était 5,8 fois celui de Malte. En 2025, le PIB par habitant était de 47 907 $ US à Malte et de 147 252 $ US au Luxembourg, soit 3,1 fois plus élevé au Luxembourg.
Malte vs Luxembourg : derniers chiffres du PIB
|
Malte
|
Luxembourg
|
|
|---|---|---|
| PIB, dollars US courants | 27,8 Md $US | 101 Md $US |
| Rang mondial | 118/197 | 75/197 |
| Part mondiale | 0,02 % | 0,09 % |
| PIB, dollars US constants de 2015 | 20,4 Md $US | 71,0 Md $US |
| Écart de PIB | 0,27× | 3,6× |
Comparer le PIB de 2 pays au choix
Sources :
- Banque mondiale | Économie et croissance (1960–2025, mis à jour en octobre 2026)
Creative Commons Attribution (CC BY) : vous pouvez copier, partager, adapter et réutiliser ce contenu, y compris à des fins commerciales, à condition de citer statistics.wiki et d’indiquer les modifications apportées. Les sources citées ci-dessus peuvent avoir leurs propres conditions de licence.