
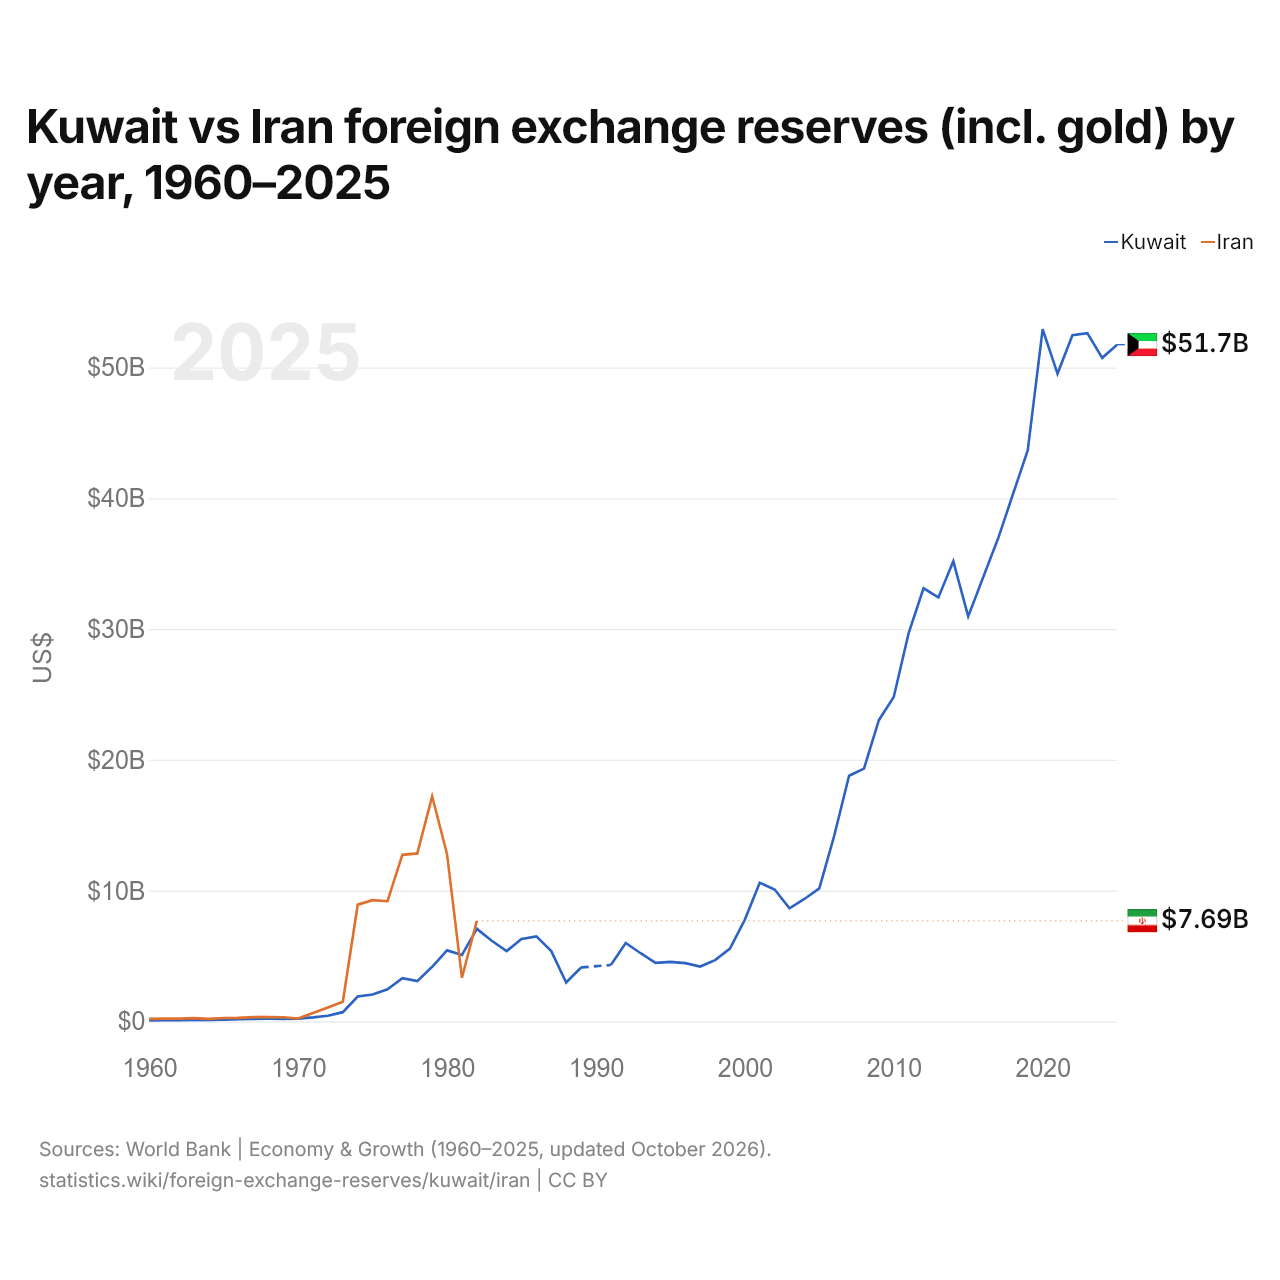
Koweït vs Iran : réserves de change (or compris) par année, 1960–2025
1x
| Année | $ US | |
|---|---|---|
 Koweït |
 Iran |
|
| 2025 | 51 737 963 292 $ US | - |
| 2024 | 50 727 942 998 $ US | - |
| 2023 | 52 619 359 335 $ US | - |
| 2022 | 52 461 721 623 $ US | - |
| 2021 | 49 525 016 981 $ US | - |
| 2020 | 52 918 606 999 $ US | - |
| 2019 | 43 668 410 965 $ US | - |
| 2018 | 40 282 453 060 $ US | - |
| 2017 | 36 889 754 717 $ US | - |
| 2016 | 33 936 274 928 $ US | - |
| 2015 | 30 960 893 268 $ US | - |
| 2014 | 35 175 442 352 $ US | - |
| 2013 | 32 410 244 557 $ US | - |
| 2012 | 33 109 896 469 $ US | - |
| 2011 | 29 681 701 460 $ US | - |
| 2010 | 24 801 842 016 $ US | - |
| 2009 | 23 028 171 516 $ US | - |
| 2008 | 19 320 771 658 $ US | - |
| 2007 | 18 776 552 865 $ US | - |
| 2006 | 14 179 782 170 $ US | - |
| 2005 | 10 165 102 735 $ US | - |
| 2004 | 9 353 825 022 $ US | - |
| 2003 | 8 636 260 734 $ US | - |
| 2002 | 10 078 199 079 $ US | - |
| 2001 | 10 599 228 051 $ US | - |
| 2000 | 7 779 055 735 $ US | - |
| 1999 | 5 560 511 603 $ US | - |
| 1998 | 4 677 696 260 $ US | - |
| 1997 | 4 188 465 732 $ US | - |
| 1996 | 4 452 441 461 $ US | - |
| 1995 | 4 542 636 862 $ US | - |
| 1994 | 4 473 605 358 $ US | - |
| 1993 | 5 205 819 228 $ US | - |
| 1992 | 5 992 939 029 $ US | - |
| 1991 | 4 306 647 353 $ US | - |
| 1990 | - | - |
| 1989 | 4 120 004 424 $ US | - |
| 1988 | 2 965 163 921 $ US | - |
| 1987 | 5 370 709 617 $ US | - |
| 1986 | 6 493 639 575 $ US | - |
| 1985 | 6 300 968 641 $ US | - |
| 1984 | 5 372 970 180 $ US | - |
| 1983 | 6 160 745 770 $ US | - |
| 1982 | 7 073 280 387 $ US | 7 685 456 407 $ US |
| 1981 | 5 076 728 716 $ US | 3 331 695 372 $ US |
| 1980 | 5 425 248 388 $ US | 12 783 023 465 $ US |
| 1979 | 4 170 019 162 $ US | 17 207 747 367 $ US |
| 1978 | 3 071 067 161 $ US | 12 840 645 493 $ US |
| 1977 | 3 297 330 596 $ US | 12 729 171 532 $ US |
| 1976 | 2 453 404 528 $ US | 9 184 961 807 $ US |
| 1975 | 2 050 783 368 $ US | 9 267 871 108 $ US |
| 1974 | 1 902 721 428 $ US | 8 920 357 632 $ US |
| 1973 | 700 276 758 $ US | 1 498 630 790 $ US |
| 1972 | 429 915 493 $ US | 1 061 180 295 $ US |
| 1971 | 301 855 036 $ US | 642 577 379 $ US |
| 1970 | 209 112 310 $ US | 216 875 910 $ US |
| 1969 | 182 617 600 $ US | 310 902 800 $ US |
| 1968 | 196 544 900 $ US | 322 136 600 $ US |
| 1967 | 184 684 400 $ US | 325 062 800 $ US |
| 1966 | 164 674 800 $ US | 268 925 660 $ US |
| 1965 | 124 077 600 $ US | 251 965 520 $ US |
| 1964 | 110 363 200 $ US | 191 508 480 $ US |
| 1963 | 109 808 800 $ US | 241 829 560 $ US |
| 1962 | 97 298 000 $ US | 210 768 020 $ US |
| 1961 | 83 886 000 $ US | 209 547 100 $ US |
| 1960 | 71 700 000 $ US | 185 218 400 $ US |
Les réserves de change du Koweït s'élèvent à 51,7 milliards de dollars (2025), et celles de l'Iran à 7,69 milliards de dollars (1982). En 1960, les réserves de l'Iran étaient 2,6 fois plus élevées : 71,7 millions de dollars pour le Koweït et 185 millions de dollars pour l'Iran.
Koweït vs Iran : réserves, or compris, et mois d'importations couverts
|
Koweït
|
Iran
|
|
|---|---|---|
| Réserves, or compris | 51,7 Md $US (2025) | 7,69 Md $US (1982) |
| Mois d'importations | 9,3 (2025) | 3,5 (1982) |
| Rang mondial | 48/168 | Non classé |
Comparer les réserves de change de 2 pays au choix
Sources :
- Banque mondiale | Économie et croissance (1960–2025, mis à jour en octobre 2026)
Creative Commons Attribution (CC BY) : vous pouvez copier, partager, adapter et réutiliser ce contenu, y compris à des fins commerciales, à condition de citer statistics.wiki et d’indiquer les modifications apportées. Les sources citées ci-dessus peuvent avoir leurs propres conditions de licence.