
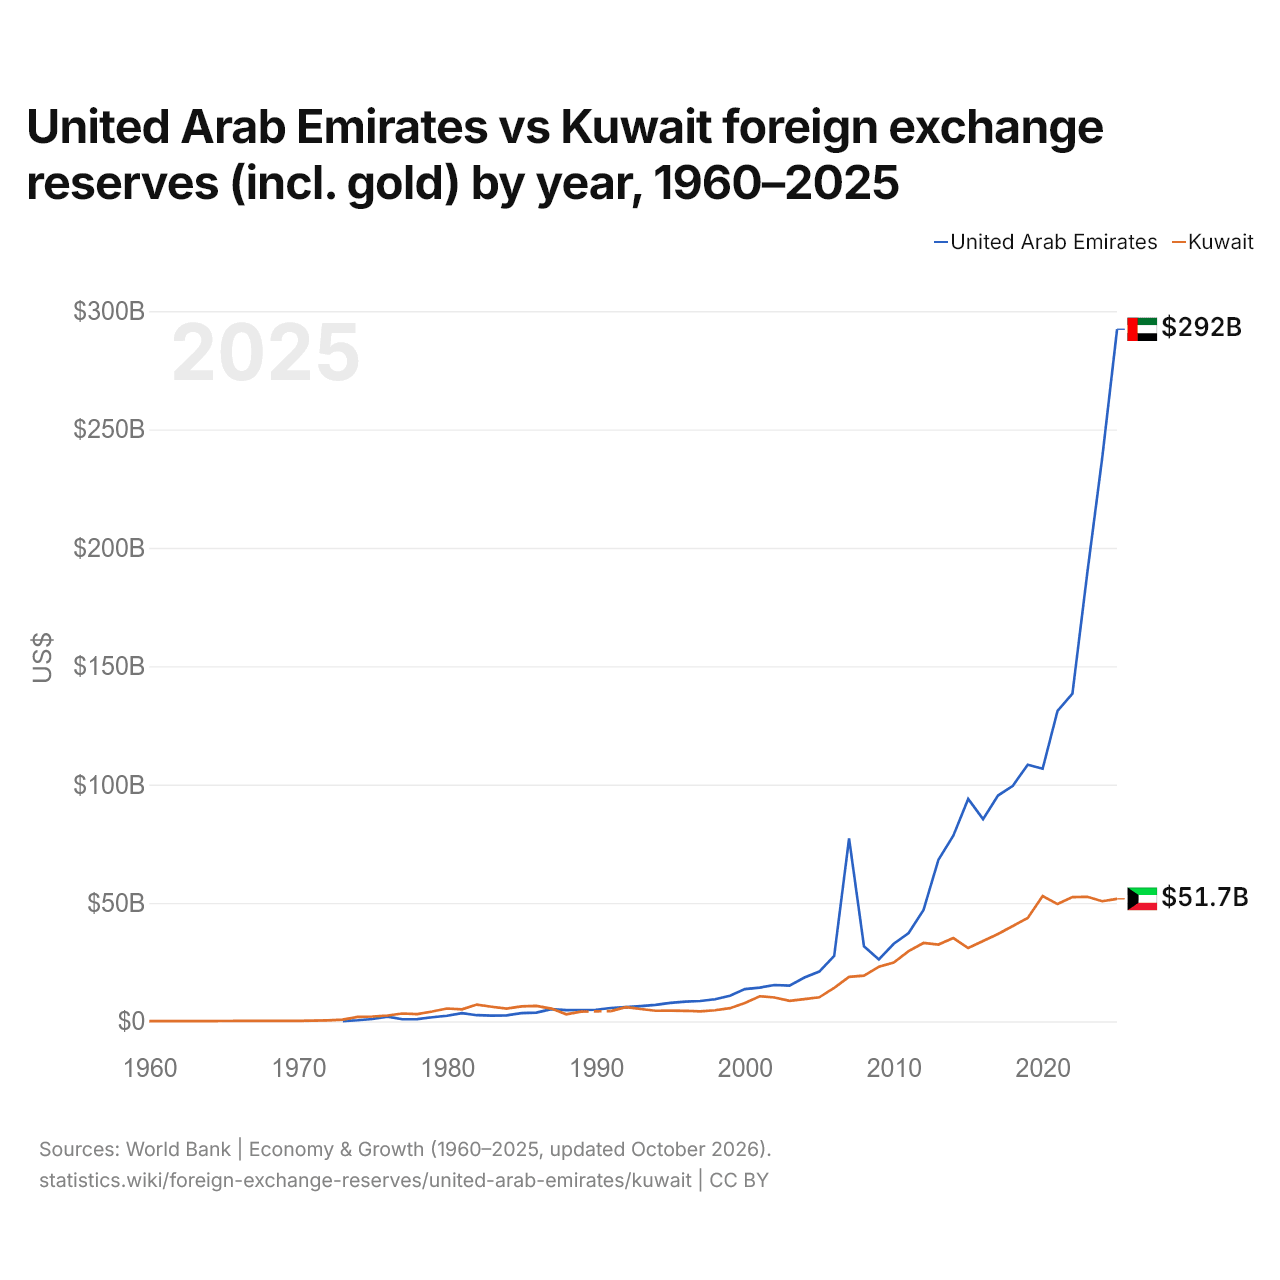
Émirats arabes unis vs Koweït : réserves de change (or compris) par année, 1960–2025
| Année | $ US | |
|---|---|---|
 EAU |
 Koweït |
|
| 2025 | 292 319 262 021 $ US | 51 737 963 292 $ US |
| 2024 | 237 931 339 945 $ US | 50 727 942 998 $ US |
| 2023 | 189 490 945 175 $ US | 52 619 359 335 $ US |
| 2022 | 138 433 303 845 $ US | 52 461 721 623 $ US |
| 2021 | 131 116 705 892 $ US | 49 525 016 981 $ US |
| 2020 | 106 701 571 777 $ US | 52 918 606 999 $ US |
| 2019 | 108 359 358 452 $ US | 43 668 410 965 $ US |
| 2018 | 99 503 335 479 $ US | 40 282 453 060 $ US |
| 2017 | 95 377 648 626 $ US | 36 889 754 717 $ US |
| 2016 | 85 390 832 746 $ US | 33 936 274 928 $ US |
| 2015 | 93 929 134 196 $ US | 30 960 893 268 $ US |
| 2014 | 78 424 381 665 $ US | 35 175 442 352 $ US |
| 2013 | 68 202 650 660 $ US | 32 410 244 557 $ US |
| 2012 | 47 035 150 431 $ US | 33 109 896 469 $ US |
| 2011 | 37 269 318 423 $ US | 29 681 701 460 $ US |
| 2010 | 32 785 291 883 $ US | 24 801 842 016 $ US |
| 2009 | 26 104 201 598 $ US | 23 028 171 516 $ US |
| 2008 | 31 694 454 694 $ US | 19 320 771 658 $ US |
| 2007 | 77 238 765 358 $ US | 18 776 552 865 $ US |
| 2006 | 27 617 445 823 $ US | 14 179 782 170 $ US |
| 2005 | 21 010 295 842 $ US | 10 165 102 735 $ US |
| 2004 | 18 529 923 698 $ US | 9 353 825 022 $ US |
| 2003 | 15 087 811 904 $ US | 8 636 260 734 $ US |
| 2002 | 15 355 431 325 $ US | 10 078 199 079 $ US |
| 2001 | 14 256 130 113 $ US | 10 599 228 051 $ US |
| 2000 | 13 631 620 189 $ US | 7 779 055 735 $ US |
| 1999 | 10 790 300 349 $ US | 5 560 511 603 $ US |
| 1998 | 9 305 872 456 $ US | 4 677 696 260 $ US |
| 1997 | 8 603 051 266 $ US | 4 188 465 732 $ US |
| 1996 | 8 350 159 124 $ US | 4 452 441 461 $ US |
| 1995 | 7 778 376 181 $ US | 4 542 636 862 $ US |
| 1994 | 6 963 509 610 $ US | 4 473 605 358 $ US |
| 1993 | 6 415 331 635 $ US | 5 205 819 228 $ US |
| 1992 | 5 977 160 986 $ US | 5 992 939 029 $ US |
| 1991 | 5 646 813 747 $ US | 4 306 647 353 $ US |
| 1990 | 4 890 564 527 $ US | - |
| 1989 | 4 776 310 582 $ US | 4 120 004 424 $ US |
| 1988 | 4 768 739 333 $ US | 2 965 163 921 $ US |
| 1987 | 5 120 925 343 $ US | 5 370 709 617 $ US |
| 1986 | 3 689 328 863 $ US | 6 493 639 575 $ US |
| 1985 | 3 471 498 477 $ US | 6 300 968 641 $ US |
| 1984 | 2 538 886 189 $ US | 5 372 970 180 $ US |
| 1983 | 2 384 157 754 $ US | 6 160 745 770 $ US |
| 1982 | 2 588 863 920 $ US | 7 073 280 387 $ US |
| 1981 | 3 471 503 445 $ US | 5 076 728 716 $ US |
| 1980 | 2 354 590 964 $ US | 5 425 248 388 $ US |
| 1979 | 1 727 429 508 $ US | 4 170 019 162 $ US |
| 1978 | 942 089 887 $ US | 3 071 067 161 $ US |
| 1977 | 894 066 095 $ US | 3 297 330 596 $ US |
| 1976 | 1 979 903 726 $ US | 2 453 404 528 $ US |
| 1975 | 987 879 902 $ US | 2 050 783 368 $ US |
| 1974 | 452 878 021 $ US | 1 902 721 428 $ US |
| 1973 | 91 723 795 $ US | 700 276 758 $ US |
| 1972 | - | 429 915 493 $ US |
| 1971 | - | 301 855 036 $ US |
| 1970 | - | 209 112 310 $ US |
| 1969 | - | 182 617 600 $ US |
| 1968 | - | 196 544 900 $ US |
| 1967 | - | 184 684 400 $ US |
| 1966 | - | 164 674 800 $ US |
| 1965 | - | 124 077 600 $ US |
| 1964 | - | 110 363 200 $ US |
| 1963 | - | 109 808 800 $ US |
| 1962 | - | 97 298 000 $ US |
| 1961 | - | 83 886 000 $ US |
| 1960 | - | 71 700 000 $ US |
En 2025, les réserves de change des Émirats arabes unis s'élevaient à 292 milliards de dollars et celles du Koweït à 51,7 milliards de dollars : celles des Émirats arabes unis étaient 5,6 fois plus élevées. En 1973, les réserves du Koweït étaient 7,6 fois plus élevées : 91,7 millions de dollars pour les Émirats arabes unis et 700 millions de dollars pour le Koweït.
Les réserves de change des Émirats arabes unis sont supérieures à celles du Koweït chaque année depuis 1993.
Émirats arabes unis vs Koweït : réserves, or compris, et mois d'importations couverts
|
EAU
|
Koweït
|
|
|---|---|---|
| Réserves, or compris | 292 Md $US | 51,7 Md $US |
| Mois d'importations | 4,7 (2023) | 9,3 (2025) |
| Rang mondial | 14/168 | 48/168 |
| Écart des réserves | 5,6× | 0,18× |
Comparer les réserves de change de 2 pays au choix
Sources :
- Banque mondiale | Économie et croissance (1960–2025, mis à jour en octobre 2026)
Creative Commons Attribution (CC BY) : vous pouvez copier, partager, adapter et réutiliser ce contenu, y compris à des fins commerciales, à condition de citer statistics.wiki et d’indiquer les modifications apportées. Les sources citées ci-dessus peuvent avoir leurs propres conditions de licence.