
Émirats arabes unis vs Suisse : réserves de change (or compris) par année, 1960–2025
| Année | $ US | |
|---|---|---|
 EAU |
 Suisse |
|
| 2025 | 292 319 262 021 $ US | 1 075 680 064 273 $ US |
| 2024 | 237 931 339 945 $ US | 909 365 744 096 $ US |
| 2023 | 189 490 945 175 $ US | 863 891 876 435 $ US |
| 2022 | 138 433 303 845 $ US | 923 627 520 641 $ US |
| 2021 | 131 116 705 892 $ US | 1 109 821 661 884 $ US |
| 2020 | 106 701 571 777 $ US | 1 083 404 342 000 $ US |
| 2019 | 108 359 358 452 $ US | 854 928 999 231 $ US |
| 2018 | 99 503 335 479 $ US | 787 021 335 044 $ US |
| 2017 | 95 377 648 626 $ US | 811 030 675 726 $ US |
| 2016 | 85 390 832 746 $ US | 678 909 680 870 $ US |
| 2015 | 93 929 134 196 $ US | 602 402 585 638 $ US |
| 2014 | 78 424 381 665 $ US | 545 787 281 753 $ US |
| 2013 | 68 202 650 660 $ US | 536 235 288 240 $ US |
| 2012 | 47 035 150 431 $ US | 531 302 252 827 $ US |
| 2011 | 37 269 318 423 $ US | 330 585 879 227 $ US |
| 2010 | 32 785 291 883 $ US | 270 479 819 574 $ US |
| 2009 | 26 104 201 598 $ US | 134 565 689 170 $ US |
| 2008 | 31 694 454 694 $ US | 74 145 636 041 $ US |
| 2007 | 77 238 765 358 $ US | 75 172 320 982 $ US |
| 2006 | 27 617 445 823 $ US | 64 461 048 830 $ US |
| 2005 | 21 010 295 842 $ US | 57 575 300 181 $ US |
| 2004 | 18 529 923 698 $ US | 74 567 877 421 $ US |
| 2003 | 15 087 811 904 $ US | 69 563 022 240 $ US |
| 2002 | 15 355 431 325 $ US | 61 276 111 966 $ US |
| 2001 | 14 256 130 113 $ US | 51 549 537 913 $ US |
| 2000 | 13 631 620 189 $ US | 53 620 270 122 $ US |
| 1999 | 10 790 300 349 $ US | 60 492 112 040 $ US |
| 1998 | 9 305 872 456 $ US | 65 157 795 246 $ US |
| 1997 | 8 603 051 266 $ US | 63 195 012 603 $ US |
| 1996 | 8 350 159 124 $ US | 69 182 548 684 $ US |
| 1995 | 7 778 376 181 $ US | 68 620 316 793 $ US |
| 1994 | 6 963 509 610 $ US | 66 645 253 531 $ US |
| 1993 | 6 415 331 635 $ US | 65 167 423 128 $ US |
| 1992 | 5 977 160 986 $ US | 61 006 849 704 $ US |
| 1991 | 5 646 813 747 $ US | 58 450 951 447 $ US |
| 1990 | 4 890 564 527 $ US | 61 284 432 315 $ US |
| 1989 | 4 776 310 582 $ US | 58 670 269 177 $ US |
| 1988 | 4 768 739 333 $ US | 58 367 104 164 $ US |
| 1987 | 5 120 925 343 $ US | 67 790 689 156 $ US |
| 1986 | 3 689 328 863 $ US | 54 339 288 832 $ US |
| 1985 | 3 471 498 477 $ US | 45 247 875 298 $ US |
| 1984 | 2 538 886 189 $ US | 40 970 392 723 $ US |
| 1983 | 2 384 157 754 $ US | 46 804 207 822 $ US |
| 1982 | 2 588 863 920 $ US | 53 509 635 004 $ US |
| 1981 | 3 471 503 445 $ US | 47 081 828 164 $ US |
| 1980 | 2 354 590 964 $ US | 64 748 106 068 $ US |
| 1979 | 1 727 429 508 $ US | 59 072 607 796 $ US |
| 1978 | 942 089 887 $ US | 36 583 417 565 $ US |
| 1977 | 894 066 095 $ US | 24 025 728 295 $ US |
| 1976 | 1 979 903 726 $ US | 20 828 006 900 $ US |
| 1975 | 987 879 902 $ US | 18 687 775 327 $ US |
| 1974 | 452 878 021 $ US | 20 962 552 960 $ US |
| 1973 | 91 723 795 $ US | 14 346 200 000 $ US |
| 1972 | - | 9 792 839 000 $ US |
| 1971 | - | 7 434 089 300 $ US |
| 1970 | - | 5 316 981 100 $ US |
| 1969 | - | 4 440 248 000 $ US |
| 1968 | - | 4 810 243 000 $ US |
| 1967 | - | 3 713 752 000 $ US |
| 1966 | - | 3 560 372 300 $ US |
| 1965 | - | 3 454 279 200 $ US |
| 1964 | - | 3 330 443 200 $ US |
| 1963 | - | 3 128 395 600 $ US |
| 1962 | - | 2 924 334 000 $ US |
| 1961 | - | 2 769 871 000 $ US |
| 1960 | - | 2 361 508 000 $ US |
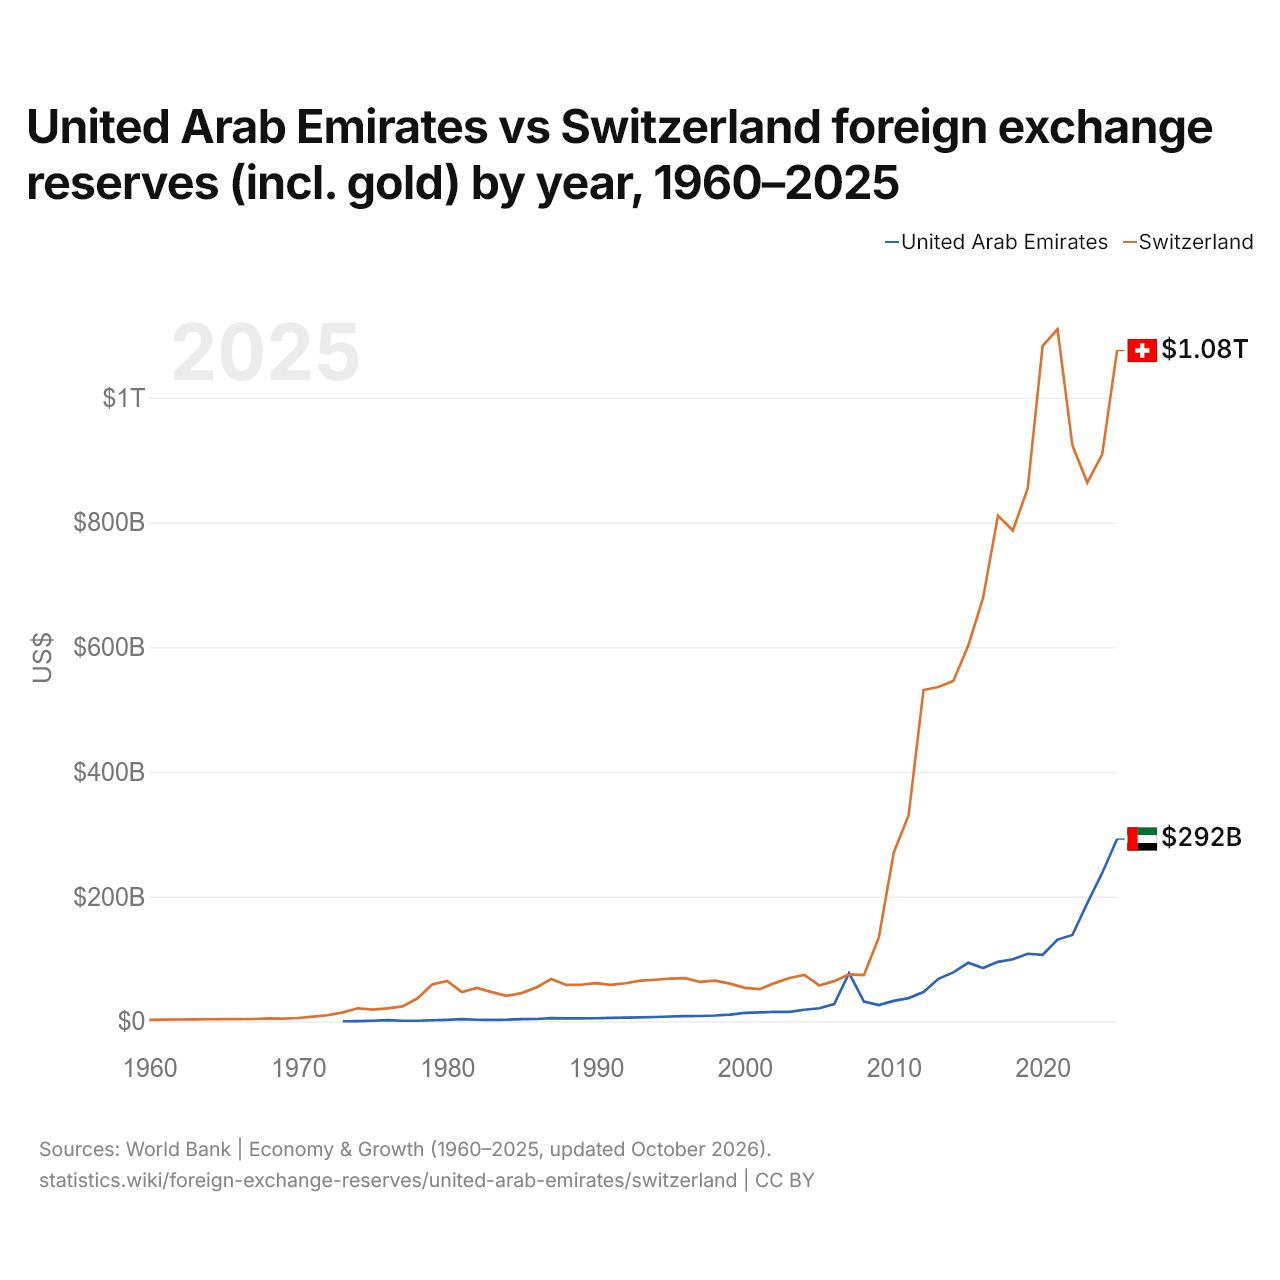
En 2025, les réserves de change des Émirats arabes unis s'élevaient à 292 milliards de dollars et celles de la Suisse à 1,08 billion de dollars : celles de la Suisse étaient 3,7 fois plus élevées. En 1973, les réserves de la Suisse étaient 160 fois plus élevées : 91,7 millions de dollars pour les Émirats arabes unis et 14,3 milliards de dollars pour la Suisse.
Les réserves de change de la Suisse sont supérieures à celles des Émirats arabes unis chaque année depuis 2008.
Émirats arabes unis vs Suisse : réserves, or compris, et mois d'importations couverts
|
EAU
|
Suisse
|
|
|---|---|---|
| Réserves, or compris | 292 Md $US | 1,08 Bn $US |
| Mois d'importations | 4,7 (2023) | 17,9 (2025) |
| Rang mondial | 14/168 | 4/168 |
| Écart des réserves | 0,27× | 3,7× |
Comparer les réserves de change de 2 pays au choix
Sources :
- Banque mondiale | Économie et croissance (1960–2025, mis à jour en octobre 2026)
Creative Commons Attribution (CC BY) : vous pouvez copier, partager, adapter et réutiliser ce contenu, y compris à des fins commerciales, à condition de citer statistics.wiki et d’indiquer les modifications apportées. Les sources citées ci-dessus peuvent avoir leurs propres conditions de licence.