
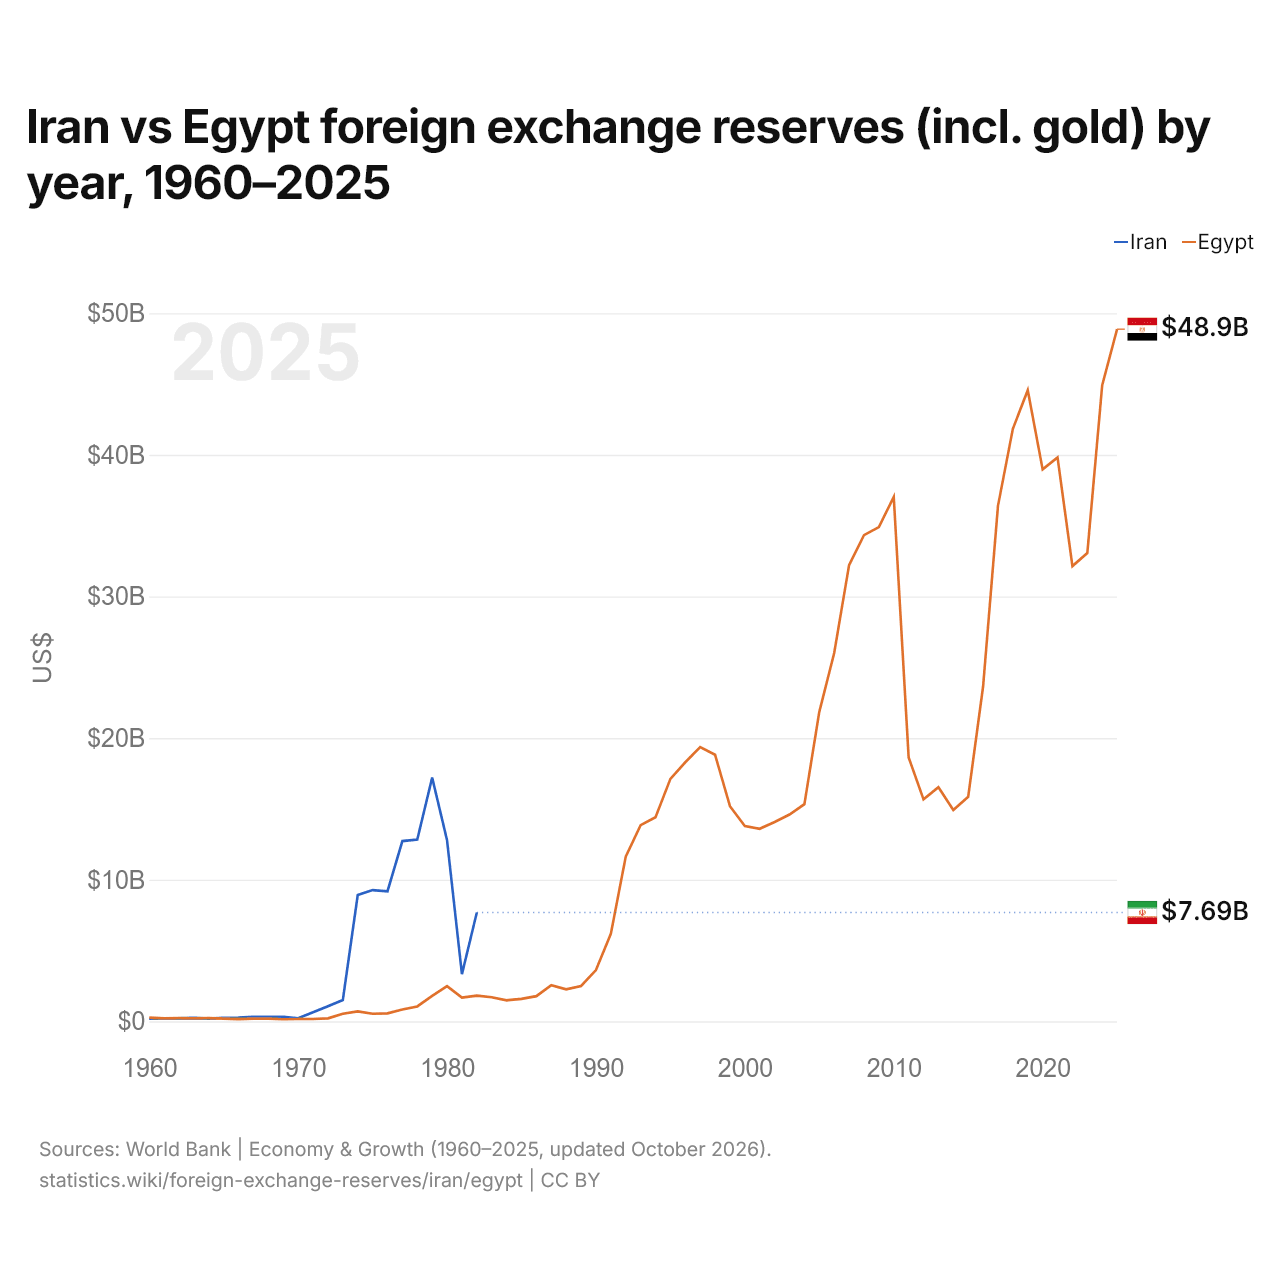
Iran vs Égypte : réserves de change (or compris) par année, 1960–2025
1x
| Année | $ US | |
|---|---|---|
 Iran |
 Égypte |
|
| 2025 | - | 48 875 494 539 $ US |
| 2024 | - | 44 921 341 018 $ US |
| 2023 | - | 33 070 180 836 $ US |
| 2022 | - | 32 143 926 008 $ US |
| 2021 | - | 39 824 388 217 $ US |
| 2020 | - | 38 972 812 937 $ US |
| 2019 | - | 44 568 837 112 $ US |
| 2018 | - | 41 839 242 991 $ US |
| 2017 | - | 36 400 242 556 $ US |
| 2016 | - | 23 642 691 706 $ US |
| 2015 | - | 15 858 887 326 $ US |
| 2014 | - | 14 926 998 052 $ US |
| 2013 | - | 16 536 236 826 $ US |
| 2012 | - | 15 672 467 971 $ US |
| 2011 | - | 18 637 541 110 $ US |
| 2010 | - | 37 028 506 135 $ US |
| 2009 | - | 34 896 678 266 $ US |
| 2008 | - | 34 330 505 048 $ US |
| 2007 | - | 32 214 421 786 $ US |
| 2006 | - | 26 006 845 068 $ US |
| 2005 | - | 21 856 784 929 $ US |
| 2004 | - | 15 338 514 717 $ US |
| 2003 | - | 14 603 576 021 $ US |
| 2002 | - | 14 076 054 423 $ US |
| 2001 | - | 13 598 234 040 $ US |
| 2000 | - | 13 785 040 868 $ US |
| 1999 | - | 15 190 021 677 $ US |
| 1998 | - | 18 823 907 998 $ US |
| 1997 | - | 19 370 588 198 $ US |
| 1996 | - | 18 296 476 061 $ US |
| 1995 | - | 17 121 798 674 $ US |
| 1994 | - | 14 412 967 685 $ US |
| 1993 | - | 13 854 276 439 $ US |
| 1992 | - | 11 620 220 748 $ US |
| 1991 | - | 6 185 285 501 $ US |
| 1990 | - | 3 619 931 743 $ US |
| 1989 | - | 2 495 363 416 $ US |
| 1988 | - | 2 261 158 623 $ US |
| 1987 | - | 2 555 643 305 $ US |
| 1986 | - | 1 779 681 032 $ US |
| 1985 | - | 1 587 362 858 $ US |
| 1984 | - | 1 485 991 444 $ US |
| 1983 | - | 1 698 907 670 $ US |
| 1982 | 7 685 456 407 $ US | 1 809 313 173 $ US |
| 1981 | 3 331 695 372 $ US | 1 682 922 621 $ US |
| 1980 | 12 783 023 465 $ US | 2 479 664 000 $ US |
| 1979 | 17 207 747 367 $ US | 1 795 125 066 $ US |
| 1978 | 12 840 645 493 $ US | 1 050 567 898 $ US |
| 1977 | 12 729 171 532 $ US | 831 886 353 $ US |
| 1976 | 9 184 961 807 $ US | 567 297 180 $ US |
| 1975 | 9 267 871 108 $ US | 535 004 017 $ US |
| 1974 | 8 920 357 632 $ US | 705 412 655 $ US |
| 1973 | 1 498 630 790 $ US | 532 593 785 $ US |
| 1972 | 1 061 180 295 $ US | 209 341 387 $ US |
| 1971 | 642 577 379 $ US | 163 240 183 $ US |
| 1970 | 216 875 910 $ US | 165 038 580 $ US |
| 1969 | 310 902 800 $ US | 145 124 800 $ US |
| 1968 | 322 136 600 $ US | 187 040 600 $ US |
| 1967 | 325 062 800 $ US | 196 019 200 $ US |
| 1966 | 268 925 660 $ US | 156 816 540 $ US |
| 1965 | 251 965 520 $ US | 193 777 600 $ US |
| 1964 | 191 508 480 $ US | 223 742 480 $ US |
| 1963 | 241 829 560 $ US | 216 277 440 $ US |
| 1962 | 210 768 020 $ US | 223 227 760 $ US |
| 1961 | 209 547 100 $ US | 203 625 200 $ US |
| 1960 | 185 218 400 $ US | 266 967 600 $ US |
Les réserves de change de l'Iran s'élèvent à 7,69 milliards de dollars (1982), et celles de l'Égypte à 48,9 milliards de dollars (2025). En 1960, les réserves de l'Égypte étaient supérieures de 44 % : 185 millions de dollars pour l'Iran et 267 millions de dollars pour l'Égypte.
Les réserves de change de l'Iran sont supérieures à celles de l'Égypte chaque année depuis 1965.
Iran vs Égypte : réserves, or compris, et mois d'importations couverts
|
Iran
|
Égypte
|
|
|---|---|---|
| Réserves, or compris | 7,69 Md $US (1982) | 48,9 Md $US (2025) |
| Mois d'importations | 3,5 (1982) | 5,1 (2025) |
| Rang mondial | Non classé | 50/168 |
Comparer les réserves de change de 2 pays au choix
Sources :
- Banque mondiale | Économie et croissance (1960–2025, mis à jour en octobre 2026)
Creative Commons Attribution (CC BY) : vous pouvez copier, partager, adapter et réutiliser ce contenu, y compris à des fins commerciales, à condition de citer statistics.wiki et d’indiquer les modifications apportées. Les sources citées ci-dessus peuvent avoir leurs propres conditions de licence.