
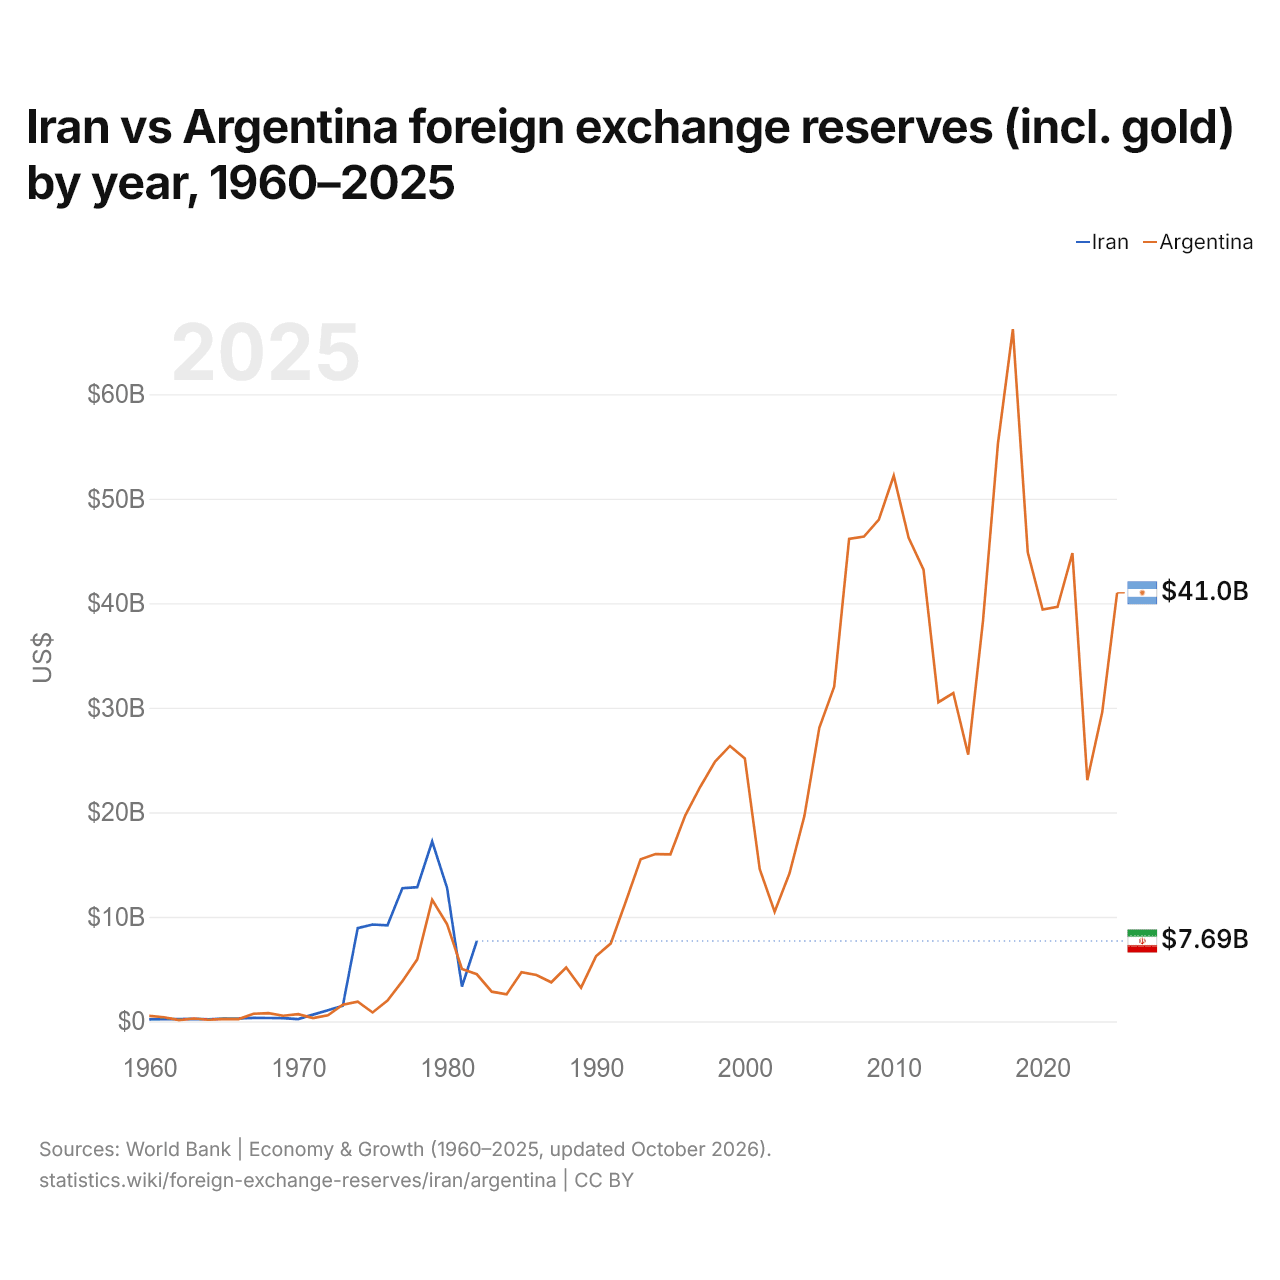
Iran vs Argentine : réserves de change (or compris) par année, 1960–2025
1x
| Année | $ US | |
|---|---|---|
 Iran |
 Argentine |
|
| 2025 | - | 40 998 763 987 $ US |
| 2024 | - | 29 559 610 351 $ US |
| 2023 | - | 23 080 560 550 $ US |
| 2022 | - | 44 795 335 172 $ US |
| 2021 | - | 39 653 498 611 $ US |
| 2020 | - | 39 403 734 630 $ US |
| 2019 | - | 44 880 566 052 $ US |
| 2018 | - | 66 221 501 691 $ US |
| 2017 | - | 55 314 409 205 $ US |
| 2016 | - | 38 414 518 492 $ US |
| 2015 | - | 25 520 565 580 $ US |
| 2014 | - | 31 410 813 270 $ US |
| 2013 | - | 30 533 919 651 $ US |
| 2012 | - | 43 223 270 864 $ US |
| 2011 | - | 46 265 800 526 $ US |
| 2010 | - | 52 207 549 724 $ US |
| 2009 | - | 48 006 988 635 $ US |
| 2008 | - | 46 385 380 207 $ US |
| 2007 | - | 46 149 456 856 $ US |
| 2006 | - | 32 022 297 113 $ US |
| 2005 | - | 28 081 718 502 $ US |
| 2004 | - | 19 659 591 804 $ US |
| 2003 | - | 14 157 284 136 $ US |
| 2002 | - | 10 492 424 819 $ US |
| 2001 | - | 14 555 552 760 $ US |
| 2000 | - | 25 152 117 244 $ US |
| 1999 | - | 26 350 163 486 $ US |
| 1998 | - | 24 855 741 222 $ US |
| 1997 | - | 22 424 600 097 $ US |
| 1996 | - | 19 719 017 351 $ US |
| 1995 | - | 15 979 453 702 $ US |
| 1994 | - | 16 003 265 688 $ US |
| 1993 | - | 15 499 431 244 $ US |
| 1992 | - | 11 447 031 157 $ US |
| 1991 | - | 7 462 543 636 $ US |
| 1990 | - | 6 222 040 363 $ US |
| 1989 | - | 3 216 875 258 $ US |
| 1988 | - | 5 157 480 787 $ US |
| 1987 | - | 3 733 969 300 $ US |
| 1986 | - | 4 427 405 700 $ US |
| 1985 | - | 4 702 644 000 $ US |
| 1984 | - | 2 590 505 132 $ US |
| 1983 | - | 2 840 273 965 $ US |
| 1982 | 7 685 456 407 $ US | 4 503 960 609 $ US |
| 1981 | 3 331 695 372 $ US | 5 006 226 776 $ US |
| 1980 | 12 783 023 465 $ US | 9 296 756 057 $ US |
| 1979 | 17 207 747 367 $ US | 11 626 505 760 $ US |
| 1978 | 12 840 645 493 $ US | 5 933 322 542 $ US |
| 1977 | 12 729 171 532 $ US | 3 843 942 355 $ US |
| 1976 | 9 184 961 807 $ US | 1 983 316 224 $ US |
| 1975 | 9 267 871 108 $ US | 848 224 746 $ US |
| 1974 | 8 920 357 632 $ US | 1 889 579 481 $ US |
| 1973 | 1 498 630 790 $ US | 1 597 255 506 $ US |
| 1972 | 1 061 180 295 $ US | 572 449 755 $ US |
| 1971 | 642 577 379 $ US | 304 314 527 $ US |
| 1970 | 216 875 910 $ US | 681 788 410 $ US |
| 1969 | 310 902 800 $ US | 538 310 000 $ US |
| 1968 | 322 136 600 $ US | 780 833 300 $ US |
| 1967 | 325 062 800 $ US | 727 208 400 $ US |
| 1966 | 268 925 660 $ US | 216 174 480 $ US |
| 1965 | 251 965 520 $ US | 236 095 840 $ US |
| 1964 | 191 508 480 $ US | 153 293 600 $ US |
| 1963 | 241 829 560 $ US | 269 807 440 $ US |
| 1962 | 210 768 020 $ US | 114 741 240 $ US |
| 1961 | 209 547 100 $ US | 386 407 550 $ US |
| 1960 | 185 218 400 $ US | 527 233 600 $ US |
Les réserves de change de l'Iran s'élèvent à 7,69 milliards de dollars (1982), et celles de l'Argentine à 41 milliards de dollars (2025). En 1960, les réserves de l'Argentine étaient 2,8 fois plus élevées : 185 millions de dollars pour l'Iran et 527 millions de dollars pour l'Argentine.
Iran vs Argentine : réserves, or compris, et mois d'importations couverts
|
Iran
|
Argentine
|
|
|---|---|---|
| Réserves, or compris | 7,69 Md $US (1982) | 41,0 Md $US (2025) |
| Mois d'importations | 3,5 (1982) | 4,9 (2025) |
| Rang mondial | Non classé | 54/168 |
Comparer les réserves de change de 2 pays au choix
Sources :
- Banque mondiale | Économie et croissance (1960–2025, mis à jour en octobre 2026)
Creative Commons Attribution (CC BY) : vous pouvez copier, partager, adapter et réutiliser ce contenu, y compris à des fins commerciales, à condition de citer statistics.wiki et d’indiquer les modifications apportées. Les sources citées ci-dessus peuvent avoir leurs propres conditions de licence.