
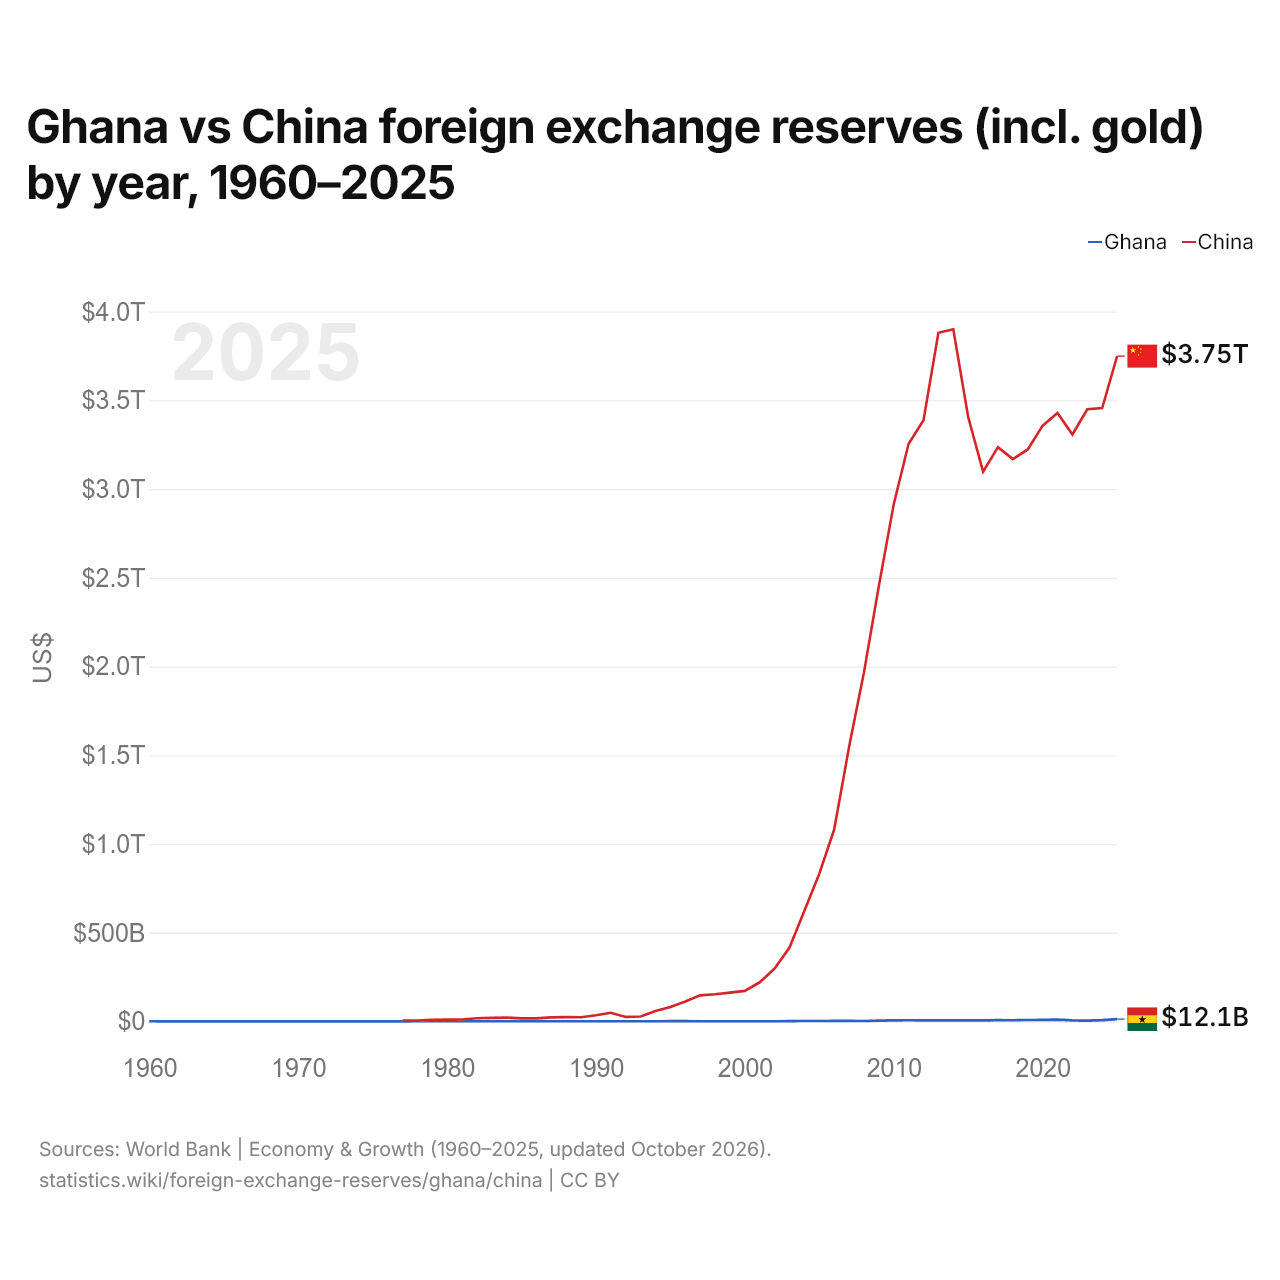
Ghana vs Chine : réserves de change (or compris) par année, 1960–2025
| Année | $ US | |
|---|---|---|
 Ghana |
 Chine |
|
| 2025 | 12 125 039 401 $ US | 3 748 744 952 818 $ US |
| 2024 | 7 117 343 743 $ US | 3 456 024 808 739 $ US |
| 2023 | 4 353 757 454 $ US | 3 449 544 415 519 $ US |
| 2022 | 5 003 523 381 $ US | 3 306 839 412 814 $ US |
| 2021 | 9 916 916 900 $ US | 3 427 931 394 629 $ US |
| 2020 | 7 884 091 539 $ US | 3 357 240 875 434 $ US |
| 2019 | 7 563 210 341 $ US | 3 222 894 578 036 $ US |
| 2018 | 6 294 851 564 $ US | 3 168 216 331 199 $ US |
| 2017 | 7 015 187 160 $ US | 3 235 681 607 213 $ US |
| 2016 | 5 866 729 596 $ US | 3 097 658 421 378 $ US |
| 2015 | 5 742 645 886 $ US | 3 405 253 363 888 $ US |
| 2014 | 5 563 709 271 $ US | 3 900 039 302 991 $ US |
| 2013 | 5 587 739 126 $ US | 3 880 368 265 253 $ US |
| 2012 | 5 835 098 328 $ US | 3 387 512 973 774 $ US |
| 2011 | 5 913 600 037 $ US | 3 254 674 063 563 $ US |
| 2010 | 5 158 151 629 $ US | 2 913 711 711 315 $ US |
| 2009 | 3 691 822 335 $ US | 2 452 899 062 068 $ US |
| 2008 | 2 014 205 287 $ US | 1 966 037 431 070 $ US |
| 2007 | 2 218 311 348 $ US | 1 546 364 660 543 $ US |
| 2006 | 2 268 926 567 $ US | 1 080 755 682 870 $ US |
| 2005 | 1 897 057 040 $ US | 831 409 619 696 $ US |
| 2004 | 1 749 729 259 $ US | 622 948 544 350 $ US |
| 2003 | 1 470 061 310 $ US | 416 199 411 549 $ US |
| 2002 | 636 059 800 $ US | 297 739 475 705 $ US |
| 2001 | 375 936 406 $ US | 220 056 777 617 $ US |
| 2000 | 308 900 898 $ US | 171 763 098 226 $ US |
| 1999 | 534 753 902 $ US | 161 414 049 492 $ US |
| 1998 | 456 699 773 $ US | 152 842 955 596 $ US |
| 1997 | 617 628 952 $ US | 146 448 007 873 $ US |
| 1996 | 930 268 682 $ US | 111 728 900 039 $ US |
| 1995 | 803 820 975 $ US | 80 288 427 870 $ US |
| 1994 | 689 267 657 $ US | 57 781 337 884 $ US |
| 1993 | 516 970 166 $ US | 27 348 104 117 $ US |
| 1992 | 411 555 106 $ US | 24 852 636 915 $ US |
| 1991 | 644 302 480 $ US | 48 165 019 103 $ US |
| 1990 | 309 313 691 $ US | 34 475 661 159 $ US |
| 1989 | 435 931 374 $ US | 23 052 566 323 $ US |
| 1988 | 310 347 217 $ US | 23 751 513 806 $ US |
| 1987 | 331 647 764 $ US | 22 453 016 928 $ US |
| 1986 | 623 972 715 $ US | 16 417 429 180 $ US |
| 1985 | 552 078 779 $ US | 16 881 047 188 $ US |
| 1984 | 437 210 813 $ US | 21 281 443 730 $ US |
| 1983 | 291 305 077 $ US | 19 831 702 778 $ US |
| 1982 | 314 337 128 $ US | 17 151 500 473 $ US |
| 1981 | 268 425 873 $ US | 10 106 339 043 $ US |
| 1980 | 329 581 762 $ US | 10 090 779 859 $ US |
| 1979 | 401 235 930 $ US | 8 707 600 000 $ US |
| 1978 | 326 657 532 $ US | 4 449 800 000 $ US |
| 1977 | 181 582 892 $ US | 4 456 360 000 $ US |
| 1976 | 113 297 798 $ US | - |
| 1975 | 147 155 059 $ US | - |
| 1974 | 101 333 085 $ US | - |
| 1973 | 194 039 305 $ US | - |
| 1972 | 104 041 174 $ US | - |
| 1971 | 43 092 238 $ US | - |
| 1970 | 42 579 200 $ US | - |
| 1969 | 71 832 000 $ US | - |
| 1968 | 97 004 000 $ US | - |
| 1967 | 82 732 000 $ US | - |
| 1966 | 111 130 400 $ US | - |
| 1965 | 132 509 200 $ US | - |
| 1964 | 122 719 200 $ US | - |
| 1963 | 122 112 800 $ US | - |
| 1962 | 159 611 200 $ US | - |
| 1961 | 155 954 000 $ US | - |
| 1960 | 277 926 000 $ US | - |
En 2025, les réserves de change du Ghana s'élevaient à 12,1 milliards de dollars et celles de la Chine à 3,75 billions de dollars : celles de la Chine étaient 310 fois plus élevées. En 1977, les réserves de la Chine étaient 25 fois plus élevées : 182 millions de dollars pour le Ghana et 4,46 milliards de dollars pour la Chine.
Les réserves de change de la Chine sont supérieures à celles du Ghana chaque année depuis 1977.
Ghana vs Chine : réserves, or compris, et mois d'importations couverts
|
Ghana
|
Chine
|
|
|---|---|---|
| Réserves, or compris | 12,1 Md $US | 3,75 Bn $US |
| Mois d'importations | 3,0 (2024) | 13,7 (2025) |
| Rang mondial | 76/168 | 1/168 |
| Écart des réserves | 0,0032× | 309× |
Comparer les réserves de change de 2 pays au choix
Sources :
- Banque mondiale | Économie et croissance (1960–2025, mis à jour en octobre 2026)
Creative Commons Attribution (CC BY) : vous pouvez copier, partager, adapter et réutiliser ce contenu, y compris à des fins commerciales, à condition de citer statistics.wiki et d’indiquer les modifications apportées. Les sources citées ci-dessus peuvent avoir leurs propres conditions de licence.