
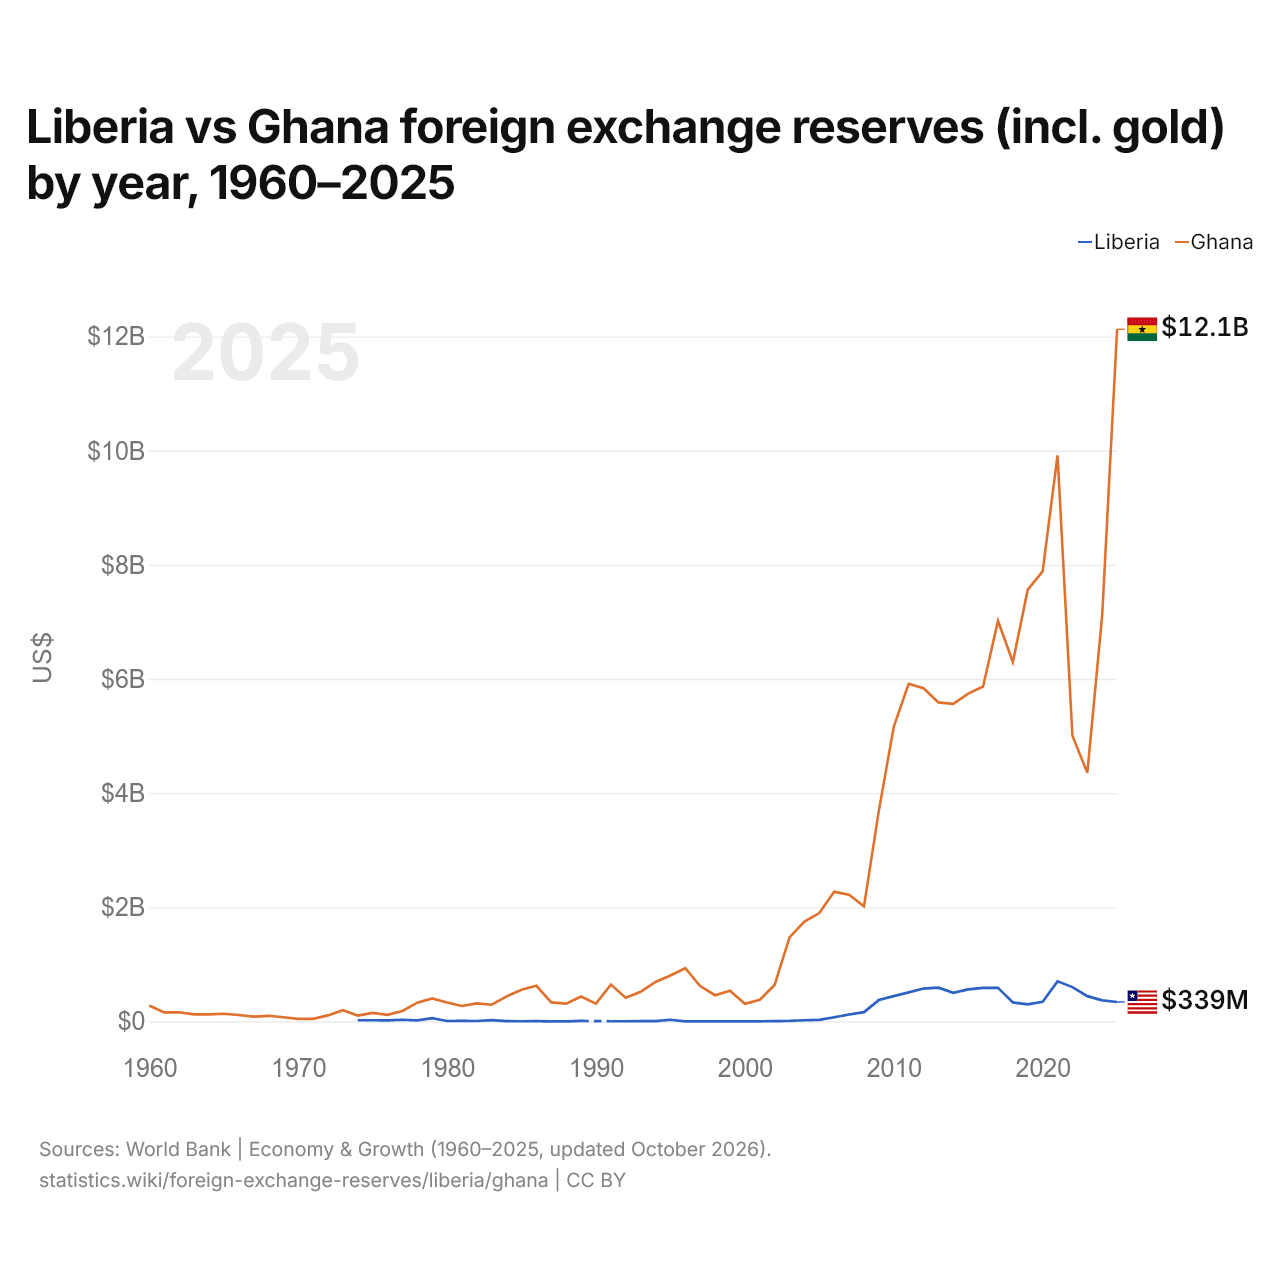
Liberia vs Ghana : réserves de change (or compris) par année, 1960–2025
1x
| Année | $ US | |
|---|---|---|
 Liberia |
 Ghana |
|
| 2025 | 338 800 672 $ US | 12 125 039 401 $ US |
| 2024 | 367 711 667 $ US | 7 117 343 743 $ US |
| 2023 | 441 429 535 $ US | 4 353 757 454 $ US |
| 2022 | 599 660 418 $ US | 5 003 523 381 $ US |
| 2021 | 700 828 780 $ US | 9 916 916 900 $ US |
| 2020 | 340 965 881 $ US | 7 884 091 539 $ US |
| 2019 | 297 070 853 $ US | 7 563 210 341 $ US |
| 2018 | 332 150 948 $ US | 6 294 851 564 $ US |
| 2017 | 585 997 777 $ US | 7 015 187 160 $ US |
| 2016 | 586 024 560 $ US | 5 866 729 596 $ US |
| 2015 | 560 742 588 $ US | 5 742 645 886 $ US |
| 2014 | 498 992 033 $ US | 5 563 709 271 $ US |
| 2013 | 589 723 180 $ US | 5 587 739 126 $ US |
| 2012 | 574 181 706 $ US | 5 835 098 328 $ US |
| 2011 | 506 827 131 $ US | 5 913 600 037 $ US |
| 2010 | 442 033 414 $ US | 5 158 151 629 $ US |
| 2009 | 372 457 052 $ US | 3 691 822 335 $ US |
| 2008 | 160 860 063 $ US | 2 014 205 287 $ US |
| 2007 | 119 359 165 $ US | 2 218 311 348 $ US |
| 2006 | 71 989 513 $ US | 2 268 926 567 $ US |
| 2005 | 25 395 461 $ US | 1 897 057 040 $ US |
| 2004 | 18 742 650 $ US | 1 749 729 259 $ US |
| 2003 | 7 376 739 $ US | 1 470 061 310 $ US |
| 2002 | 3 298 471 $ US | 636 059 800 $ US |
| 2001 | 480 276 $ US | 375 936 406 $ US |
| 2000 | 267 707 $ US | 308 900 898 $ US |
| 1999 | 431 082 $ US | 534 753 902 $ US |
| 1998 | 616 575 $ US | 456 699 773 $ US |
| 1997 | 419 971 $ US | 617 628 952 $ US |
| 1996 | 376 467 $ US | 930 268 682 $ US |
| 1995 | 28 088 833 $ US | 803 820 975 $ US |
| 1994 | 5 069 083 $ US | 689 267 657 $ US |
| 1993 | 2 362 460 $ US | 516 970 166 $ US |
| 1992 | 977 250 $ US | 411 555 106 $ US |
| 1991 | 1 307 913 $ US | 644 302 480 $ US |
| 1990 | - | 309 313 691 $ US |
| 1989 | 7 876 425 $ US | 435 931 374 $ US |
| 1988 | 380 371 $ US | 310 347 217 $ US |
| 1987 | 509 560 $ US | 331 647 764 $ US |
| 1986 | 2 660 464 $ US | 623 972 715 $ US |
| 1985 | 1 517 968 $ US | 552 078 779 $ US |
| 1984 | 3 476 406 $ US | 437 210 813 $ US |
| 1983 | 20 396 000 $ US | 291 305 077 $ US |
| 1982 | 6 473 031 $ US | 314 337 128 $ US |
| 1981 | 8 336 711 $ US | 268 425 873 $ US |
| 1980 | 5 450 000 $ US | 329 581 762 $ US |
| 1979 | 54 979 006 $ US | 401 235 930 $ US |
| 1978 | 18 021 338 $ US | 326 657 532 $ US |
| 1977 | 27 344 993 $ US | 181 582 892 $ US |
| 1976 | 17 169 647 $ US | 113 297 798 $ US |
| 1975 | 19 188 682 $ US | 147 155 059 $ US |
| 1974 | 18 718 548 $ US | 101 333 085 $ US |
| 1973 | - | 194 039 305 $ US |
| 1972 | - | 104 041 174 $ US |
| 1971 | - | 43 092 238 $ US |
| 1970 | - | 42 579 200 $ US |
| 1969 | - | 71 832 000 $ US |
| 1968 | - | 97 004 000 $ US |
| 1967 | - | 82 732 000 $ US |
| 1966 | - | 111 130 400 $ US |
| 1965 | - | 132 509 200 $ US |
| 1964 | - | 122 719 200 $ US |
| 1963 | - | 122 112 800 $ US |
| 1962 | - | 159 611 200 $ US |
| 1961 | - | 155 954 000 $ US |
| 1960 | - | 277 926 000 $ US |
En 2025, les réserves de change du Liberia s'élevaient à 339 millions de dollars et celles du Ghana à 12,1 milliards de dollars : celles du Ghana étaient 36 fois plus élevées. En 1974, les réserves du Ghana étaient 5,4 fois plus élevées : 18,7 millions de dollars pour le Liberia et 101 millions de dollars pour le Ghana.
Liberia vs Ghana : réserves, or compris, et mois d'importations couverts
|
Liberia
|
Ghana
|
|
|---|---|---|
| Réserves, or compris | 339 M $US | 12,1 Md $US |
| Mois d'importations | n.d. | 3,0 (2024) |
| Rang mondial | 161/168 | 76/168 |
| Écart des réserves | 0,028× | 36× |
Comparer les réserves de change de 2 pays au choix
Sources :
- Banque mondiale | Économie et croissance (1960–2025, mis à jour en octobre 2026)
Creative Commons Attribution (CC BY) : vous pouvez copier, partager, adapter et réutiliser ce contenu, y compris à des fins commerciales, à condition de citer statistics.wiki et d’indiquer les modifications apportées. Les sources citées ci-dessus peuvent avoir leurs propres conditions de licence.