
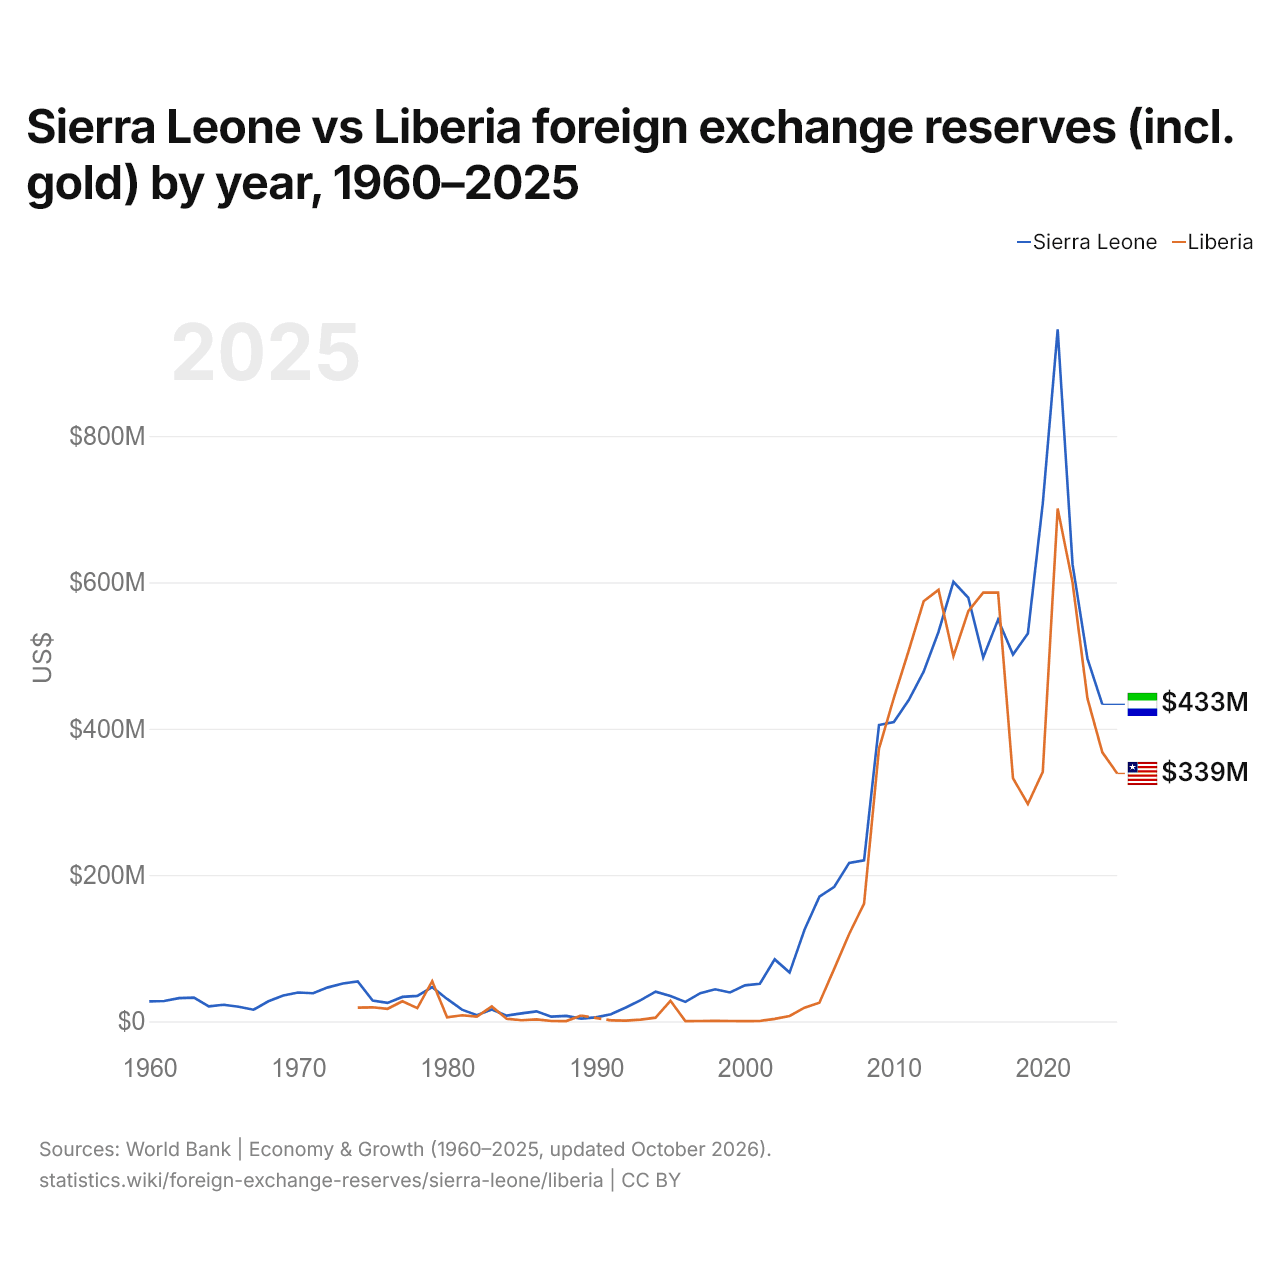
Sierra Leone vs Liberia : réserves de change (or compris) par année, 1960–2025
| Année | $ US | |
|---|---|---|
 Sierra Leone |
 Liberia |
|
| 2025 | - | 338 800 672 $ US |
| 2024 | 433 270 129 $ US | 367 711 667 $ US |
| 2023 | 495 698 794 $ US | 441 429 535 $ US |
| 2022 | 624 496 475 $ US | 599 660 418 $ US |
| 2021 | 945 907 747 $ US | 700 828 780 $ US |
| 2020 | 707 703 898 $ US | 340 965 881 $ US |
| 2019 | 530 137 881 $ US | 297 070 853 $ US |
| 2018 | 501 210 760 $ US | 332 150 948 $ US |
| 2017 | 549 121 051 $ US | 585 997 777 $ US |
| 2016 | 497 242 647 $ US | 586 024 560 $ US |
| 2015 | 579 013 521 $ US | 560 742 588 $ US |
| 2014 | 600 784 544 $ US | 498 992 033 $ US |
| 2013 | 532 538 017 $ US | 589 723 180 $ US |
| 2012 | 477 987 068 $ US | 574 181 706 $ US |
| 2011 | 439 130 953 $ US | 506 827 131 $ US |
| 2010 | 408 971 756 $ US | 442 033 414 $ US |
| 2009 | 404 964 509 $ US | 372 457 052 $ US |
| 2008 | 220 167 661 $ US | 160 860 063 $ US |
| 2007 | 216 555 181 $ US | 119 359 165 $ US |
| 2006 | 183 927 216 $ US | 71 989 513 $ US |
| 2005 | 170 505 508 $ US | 25 395 461 $ US |
| 2004 | 125 104 244 $ US | 18 742 650 $ US |
| 2003 | 66 617 191 $ US | 7 376 739 $ US |
| 2002 | 84 690 145 $ US | 3 298 471 $ US |
| 2001 | 51 311 629 $ US | 480 276 $ US |
| 2000 | 49 207 274 $ US | 267 707 $ US |
| 1999 | 39 474 580 $ US | 431 082 $ US |
| 1998 | 43 857 038 $ US | 616 575 $ US |
| 1997 | 38 464 890 $ US | 419 971 $ US |
| 1996 | 26 591 785 $ US | 376 467 $ US |
| 1995 | 34 618 041 $ US | 28 088 833 $ US |
| 1994 | 40 639 714 $ US | 5 069 083 $ US |
| 1993 | 28 965 194 $ US | 2 362 460 $ US |
| 1992 | 18 925 006 $ US | 977 250 $ US |
| 1991 | 9 628 609 $ US | 1 307 913 $ US |
| 1990 | 5 428 453 $ US | - |
| 1989 | 3 726 283 $ US | 7 876 425 $ US |
| 1988 | 7 426 914 $ US | 380 371 $ US |
| 1987 | 6 328 373 $ US | 509 560 $ US |
| 1986 | 13 654 727 $ US | 2 660 464 $ US |
| 1985 | 10 821 968 $ US | 1 517 968 $ US |
| 1984 | 7 749 010 $ US | 3 476 406 $ US |
| 1983 | 16 204 696 $ US | 20 396 000 $ US |
| 1982 | 8 429 492 $ US | 6 473 031 $ US |
| 1981 | 15 950 187 $ US | 8 336 711 $ US |
| 1980 | 30 600 000 $ US | 5 450 000 $ US |
| 1979 | 46 700 000 $ US | 54 979 006 $ US |
| 1978 | 34 786 615 $ US | 18 021 338 $ US |
| 1977 | 33 400 598 $ US | 27 344 993 $ US |
| 1976 | 25 204 166 $ US | 17 169 647 $ US |
| 1975 | 28 412 395 $ US | 19 188 682 $ US |
| 1974 | 54 623 870 $ US | 18 718 548 $ US |
| 1973 | 51 775 198 $ US | - |
| 1972 | 46 452 033 $ US | - |
| 1971 | 38 407 453 $ US | - |
| 1970 | 39 360 000 $ US | - |
| 1969 | 35 400 000 $ US | - |
| 1968 | 27 500 000 $ US | - |
| 1967 | 15 900 000 $ US | - |
| 1966 | 20 000 000 $ US | - |
| 1965 | 22 640 000 $ US | - |
| 1964 | 20 444 000 $ US | - |
| 1963 | 32 500 000 $ US | - |
| 1962 | 31 800 000 $ US | - |
| 1961 | 27 800 000 $ US | - |
| 1960 | 27 200 000 $ US | - |
Les réserves de change de la Sierra Leone s'élevaient à 433 millions de dollars (2024) et celles du Liberia à 368 millions de dollars (2024) : celles de la Sierra Leone étaient supérieures de 18 %. En 1974, les réserves de la Sierra Leone étaient 2,9 fois plus élevées : 54,6 millions de dollars pour la Sierra Leone et 18,7 millions de dollars pour le Liberia.
Les réserves de change de la Sierra Leone sont supérieures à celles du Liberia chaque année depuis 2018.
Sierra Leone vs Liberia : réserves, or compris, et mois d'importations couverts
|
Sierra Leone
|
Liberia
|
|
|---|---|---|
| Réserves, or compris | 433 M $US (2024) | 339 M $US (2025) |
| Mois d'importations | 3,2 (2024) | n.d. |
| Rang mondial | 156/168 | 161/168 |
Comparer les réserves de change de 2 pays au choix
Sources :
- Banque mondiale | Économie et croissance (1960–2025, mis à jour en octobre 2026)
Creative Commons Attribution (CC BY) : vous pouvez copier, partager, adapter et réutiliser ce contenu, y compris à des fins commerciales, à condition de citer statistics.wiki et d’indiquer les modifications apportées. Les sources citées ci-dessus peuvent avoir leurs propres conditions de licence.