
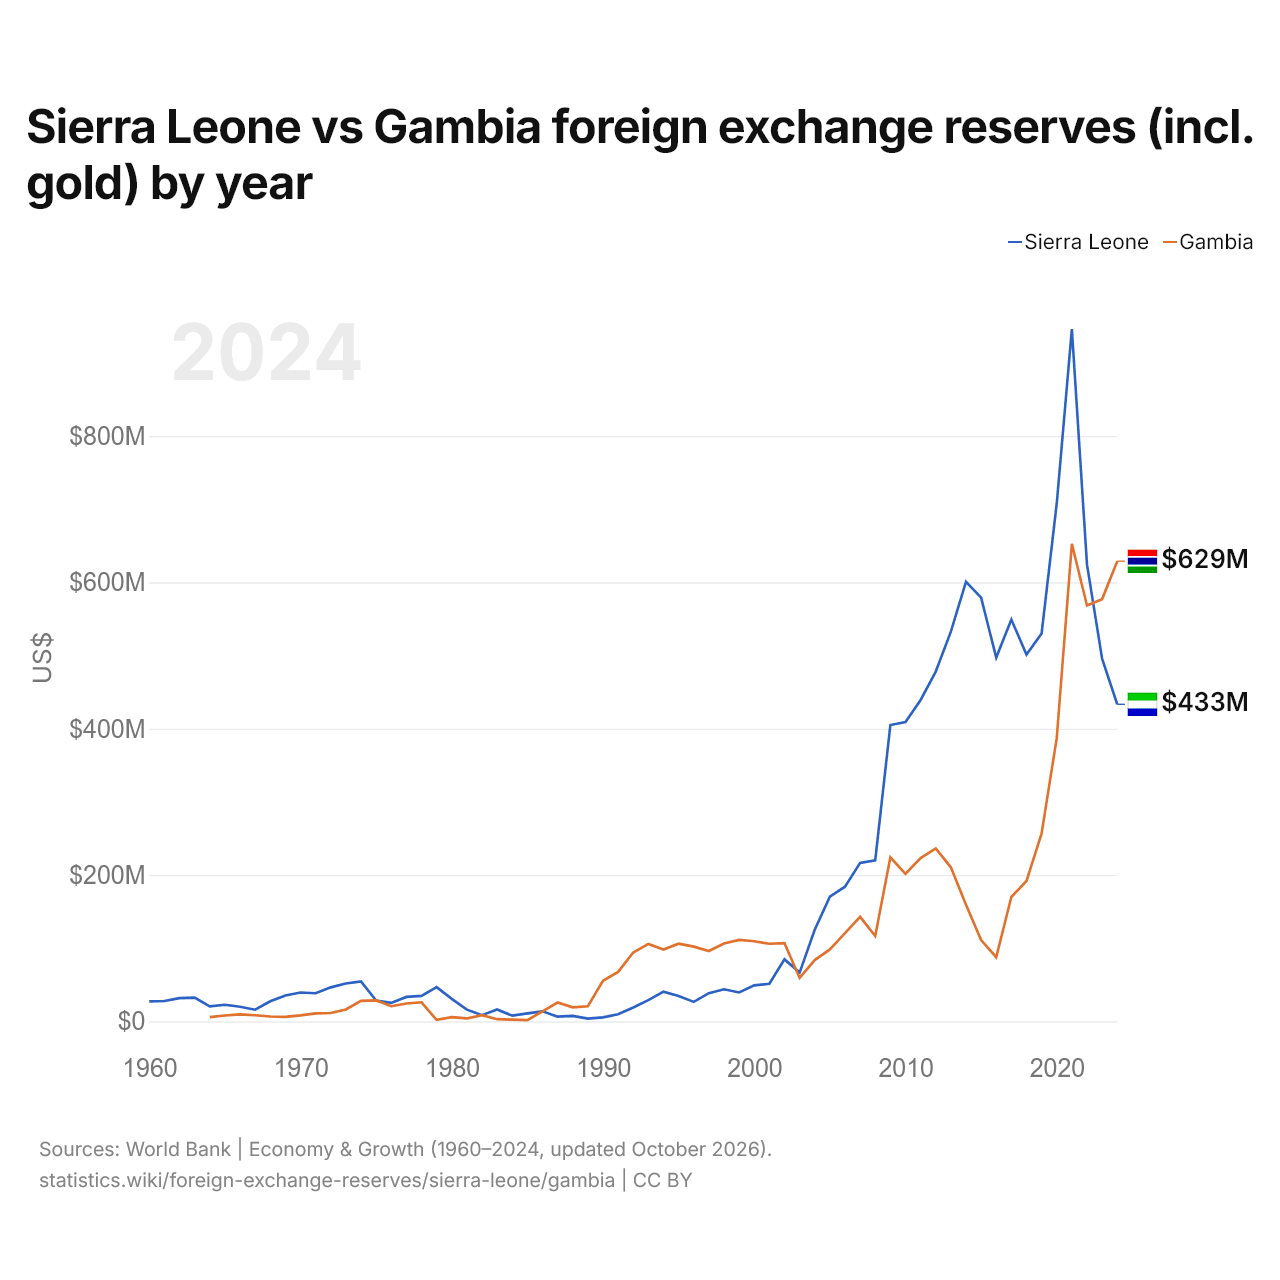
Sierra Leone vs Gambie : réserves de change (or compris) par année
1x
| Année | $ US | |
|---|---|---|
 Sierra Leone |
 Gambie |
|
| 2024 | 433 270 129 $ US | 628 849 157 $ US |
| 2023 | 495 698 794 $ US | 577 028 229 $ US |
| 2022 | 624 496 475 $ US | 568 244 498 $ US |
| 2021 | 945 907 747 $ US | 652 670 952 $ US |
| 2020 | 707 703 898 $ US | 387 046 404 $ US |
| 2019 | 530 137 881 $ US | 256 957 422 $ US |
| 2018 | 501 210 760 $ US | 191 773 261 $ US |
| 2017 | 549 121 051 $ US | 169 969 976 $ US |
| 2016 | 497 242 647 $ US | 87 635 582 $ US |
| 2015 | 579 013 521 $ US | 111 040 203 $ US |
| 2014 | 600 784 544 $ US | 159 330 829 $ US |
| 2013 | 532 538 017 $ US | 210 553 599 $ US |
| 2012 | 477 987 068 $ US | 236 241 441 $ US |
| 2011 | 439 130 953 $ US | 223 241 853 $ US |
| 2010 | 408 971 756 $ US | 201 627 627 $ US |
| 2009 | 404 964 509 $ US | 224 175 097 $ US |
| 2008 | 220 167 661 $ US | 116 517 123 $ US |
| 2007 | 216 555 181 $ US | 142 784 445 $ US |
| 2006 | 183 927 216 $ US | 120 615 998 $ US |
| 2005 | 170 505 508 $ US | 98 312 849 $ US |
| 2004 | 125 104 244 $ US | 83 774 361 $ US |
| 2003 | 66 617 191 $ US | 59 306 559 $ US |
| 2002 | 84 690 145 $ US | 106 877 407 $ US |
| 2001 | 51 311 629 $ US | 106 013 174 $ US |
| 2000 | 49 207 274 $ US | 109 431 119 $ US |
| 1999 | 39 474 580 $ US | 111 246 413 $ US |
| 1998 | 43 857 038 $ US | 106 362 060 $ US |
| 1997 | 38 464 890 $ US | 96 038 246 $ US |
| 1996 | 26 591 785 $ US | 102 133 832 $ US |
| 1995 | 34 618 041 $ US | 106 146 503 $ US |
| 1994 | 40 639 714 $ US | 98 016 032 $ US |
| 1993 | 28 965 194 $ US | 105 752 906 $ US |
| 1992 | 18 925 006 $ US | 94 033 760 $ US |
| 1991 | 9 628 609 $ US | 67 615 346 $ US |
| 1990 | 5 428 453 $ US | 55 386 775 $ US |
| 1989 | 3 726 283 $ US | 20 589 297 $ US |
| 1988 | 7 426 914 $ US | 19 049 153 $ US |
| 1987 | 6 328 373 $ US | 25 757 395 $ US |
| 1986 | 13 654 727 $ US | 13 562 846 $ US |
| 1985 | 10 821 968 $ US | 1 733 937 $ US |
| 1984 | 7 749 010 $ US | 2 259 208 $ US |
| 1983 | 16 204 696 $ US | 2 917 513 $ US |
| 1982 | 8 429 492 $ US | 8 386 497 $ US |
| 1981 | 15 950 187 $ US | 3 948 198 $ US |
| 1980 | 30 600 000 $ US | 5 670 000 $ US |
| 1979 | 46 700 000 $ US | 1 928 959 $ US |
| 1978 | 34 786 615 $ US | 26 072 159 $ US |
| 1977 | 33 400 598 $ US | 24 394 653 $ US |
| 1976 | 25 204 166 $ US | 20 635 250 $ US |
| 1975 | 28 412 395 $ US | 28 551 676 $ US |
| 1974 | 54 623 870 $ US | 28 045 553 $ US |
| 1973 | 51 775 198 $ US | 16 240 625 $ US |
| 1972 | 46 452 033 $ US | 11 384 580 $ US |
| 1971 | 38 407 453 $ US | 10 939 434 $ US |
| 1970 | 39 360 000 $ US | 8 110 000 $ US |
| 1969 | 35 400 000 $ US | 5 990 000 $ US |
| 1968 | 27 500 000 $ US | 6 550 000 $ US |
| 1967 | 15 900 000 $ US | 8 370 000 $ US |
| 1966 | 20 000 000 $ US | 9 450 000 $ US |
| 1965 | 22 640 000 $ US | 7 950 000 $ US |
| 1964 | 20 444 000 $ US | 5 850 000 $ US |
| 1963 | 32 500 000 $ US | - |
| 1962 | 31 800 000 $ US | - |
| 1961 | 27 800 000 $ US | - |
| 1960 | 27 200 000 $ US | - |
Les réserves de change de la Sierra Leone s'élèvent à 433 millions de dollars (2024) et celles de la Gambie à 629 millions de dollars (2024) : celles de la Gambie sont supérieures de 45 %. En 1964, les réserves de la Sierra Leone étaient 3,5 fois plus élevées : 20,4 millions de dollars pour la Sierra Leone et 5,85 millions de dollars pour la Gambie.
Sierra Leone vs Gambie : réserves, or compris, et mois d'importations couverts
|
Sierra Leone
|
Gambie
|
|
|---|---|---|
| Réserves, or compris | 433 M $US | 629 M $US |
| Mois d'importations | 3,2 | 9,4 |
| Rang mondial | 156/168 | 146/168 |
| Écart des réserves | 0,69× | 1,5× |
Comparer les réserves de change de 2 pays au choix
Sources :
- Banque mondiale | Économie et croissance (1960–2024, mis à jour en octobre 2026)
Creative Commons Attribution (CC BY) : vous pouvez copier, partager, adapter et réutiliser ce contenu, y compris à des fins commerciales, à condition de citer statistics.wiki et d’indiquer les modifications apportées. Les sources citées ci-dessus peuvent avoir leurs propres conditions de licence.