
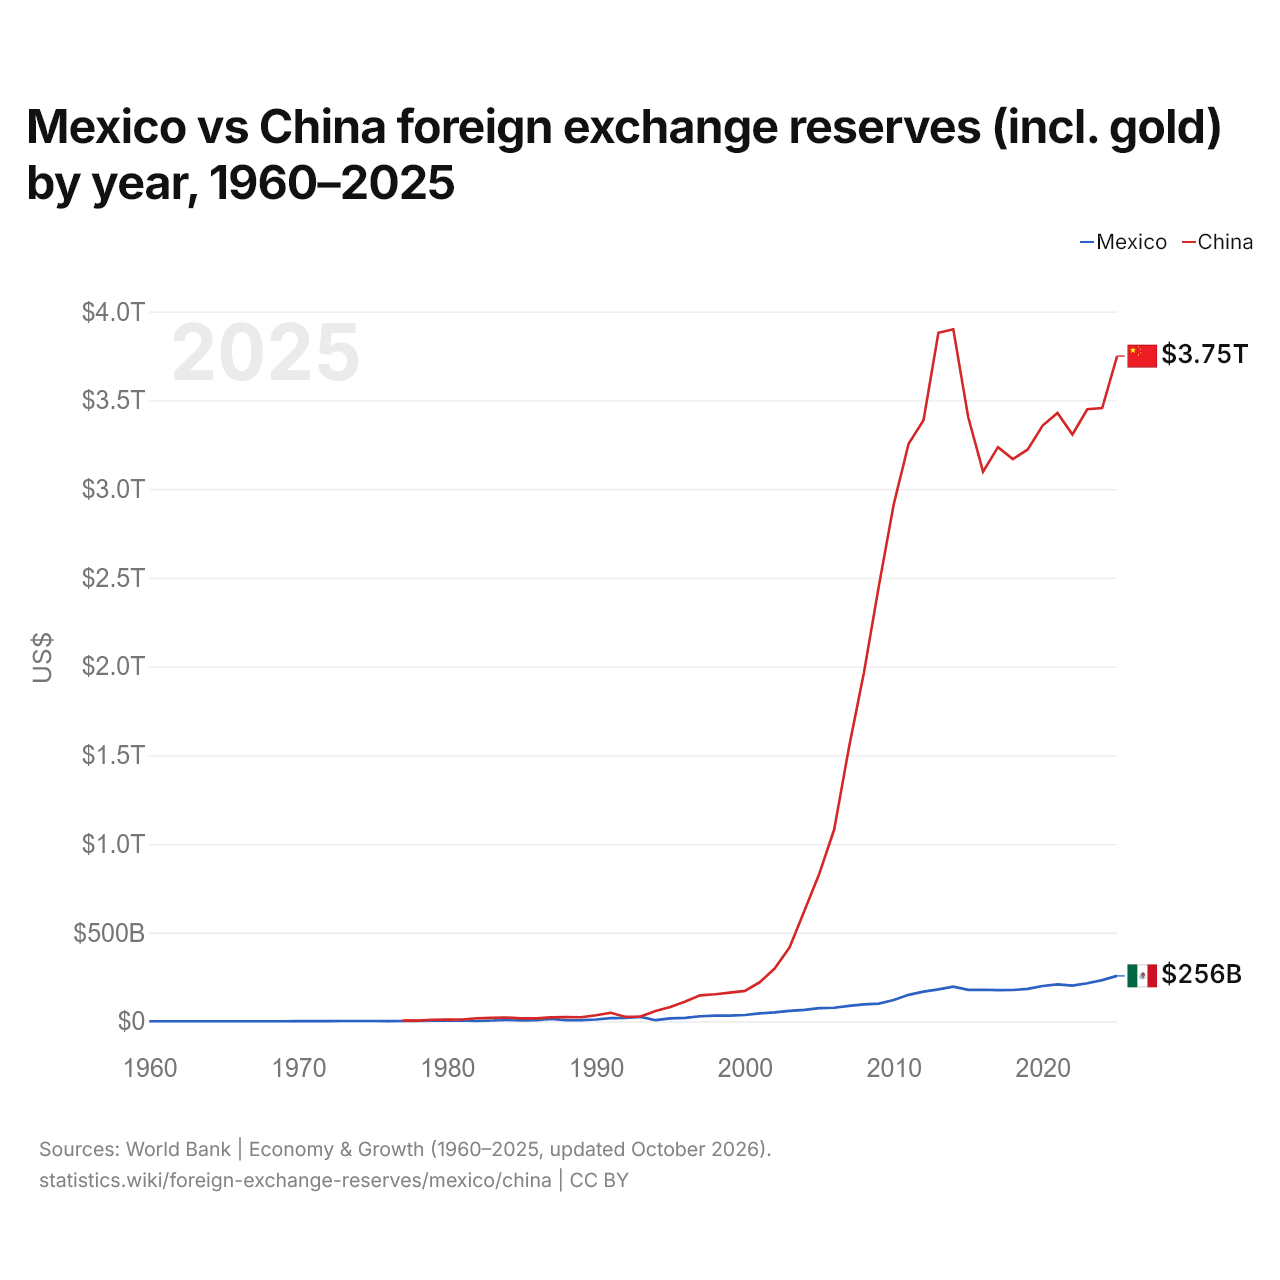
Mexique vs Chine : réserves de change (or compris) par année, 1960–2025
| Année | $ US | |
|---|---|---|
 Mexique |
 Chine |
|
| 2025 | 256 178 680 249 $ US | 3 748 744 952 818 $ US |
| 2024 | 232 035 392 465 $ US | 3 456 024 808 739 $ US |
| 2023 | 214 316 827 085 $ US | 3 449 544 415 519 $ US |
| 2022 | 201 118 689 946 $ US | 3 306 839 412 814 $ US |
| 2021 | 207 799 490 381 $ US | 3 427 931 394 629 $ US |
| 2020 | 199 069 188 921 $ US | 3 357 240 875 434 $ US |
| 2019 | 183 056 094 118 $ US | 3 222 894 578 036 $ US |
| 2018 | 176 390 278 596 $ US | 3 168 216 331 199 $ US |
| 2017 | 175 469 669 184 $ US | 3 235 681 607 213 $ US |
| 2016 | 177 973 637 255 $ US | 3 097 658 421 378 $ US |
| 2015 | 177 596 632 553 $ US | 3 405 253 363 888 $ US |
| 2014 | 195 681 624 546 $ US | 3 900 039 302 991 $ US |
| 2013 | 180 200 033 350 $ US | 3 880 368 265 253 $ US |
| 2012 | 167 075 785 316 $ US | 3 387 512 973 774 $ US |
| 2011 | 149 208 113 907 $ US | 3 254 674 063 563 $ US |
| 2010 | 120 584 016 515 $ US | 2 913 711 711 315 $ US |
| 2009 | 99 888 815 494 $ US | 2 452 899 062 068 $ US |
| 2008 | 95 299 838 183 $ US | 1 966 037 431 070 $ US |
| 2007 | 87 208 175 923 $ US | 1 546 364 660 543 $ US |
| 2006 | 76 329 367 204 $ US | 1 080 755 682 870 $ US |
| 2005 | 74 109 703 346 $ US | 831 409 619 696 $ US |
| 2004 | 64 201 699 863 $ US | 622 948 544 350 $ US |
| 2003 | 59 026 700 311 $ US | 416 199 411 549 $ US |
| 2002 | 50 671 452 145 $ US | 297 739 475 705 $ US |
| 2001 | 44 804 667 773 $ US | 220 056 777 617 $ US |
| 2000 | 35 577 279 054 $ US | 171 763 098 226 $ US |
| 1999 | 31 828 401 325 $ US | 161 414 049 492 $ US |
| 1998 | 31 863 181 980 $ US | 152 842 955 596 $ US |
| 1997 | 28 852 477 361 $ US | 146 448 007 873 $ US |
| 1996 | 19 526 913 036 $ US | 111 728 900 039 $ US |
| 1995 | 17 045 558 633 $ US | 80 288 427 870 $ US |
| 1994 | 6 441 390 536 $ US | 57 781 337 884 $ US |
| 1993 | 25 298 703 698 $ US | 27 348 104 117 $ US |
| 1992 | 19 171 357 434 $ US | 24 852 636 915 $ US |
| 1991 | 18 052 066 982 $ US | 48 165 019 103 $ US |
| 1990 | 10 216 845 194 $ US | 34 475 661 159 $ US |
| 1989 | 6 740 245 011 $ US | 23 052 566 323 $ US |
| 1988 | 6 326 668 370 $ US | 23 751 513 806 $ US |
| 1987 | 13 691 985 454 $ US | 22 453 016 928 $ US |
| 1986 | 6 673 540 003 $ US | 16 417 429 180 $ US |
| 1985 | 5 678 880 167 $ US | 16 881 047 188 $ US |
| 1984 | 8 018 704 803 $ US | 21 281 443 730 $ US |
| 1983 | 4 793 446 679 $ US | 19 831 702 778 $ US |
| 1982 | 1 777 613 442 $ US | 17 151 500 473 $ US |
| 1981 | 4 971 260 746 $ US | 10 106 339 043 $ US |
| 1980 | 4 175 319 837 $ US | 10 090 779 859 $ US |
| 1979 | 3 087 692 135 $ US | 8 707 600 000 $ US |
| 1978 | 2 269 381 533 $ US | 4 449 800 000 $ US |
| 1977 | 1 938 338 555 $ US | 4 456 360 000 $ US |
| 1976 | 1 403 804 527 $ US | - |
| 1975 | 1 896 784 593 $ US | - |
| 1974 | 1 920 866 300 $ US | - |
| 1973 | 1 679 817 085 $ US | - |
| 1972 | 1 296 684 257 $ US | - |
| 1971 | 981 458 345 $ US | - |
| 1970 | 756 033 730 $ US | - |
| 1969 | 663 370 800 $ US | - |
| 1968 | 689 436 600 $ US | - |
| 1967 | 586 953 600 $ US | - |
| 1966 | 564 571 660 $ US | - |
| 1965 | 538 031 680 $ US | - |
| 1964 | 587 594 480 $ US | - |
| 1963 | 548 302 680 $ US | - |
| 1962 | 427 198 020 $ US | - |
| 1961 | 413 480 000 $ US | - |
| 1960 | 444 341 600 $ US | - |
En 2025, les réserves de change du Mexique s'élevaient à 256 milliards de dollars et celles de la Chine à 3,75 billions de dollars : celles de la Chine étaient 15 fois plus élevées. En 1977, les réserves de la Chine étaient 2,3 fois plus élevées : 1,94 milliard de dollars pour le Mexique et 4,46 milliards de dollars pour la Chine.
Les réserves de change de la Chine sont supérieures à celles du Mexique chaque année depuis 1977.
Mexique vs Chine : réserves, or compris, et mois d'importations couverts
|
Mexique
|
Chine
|
|
|---|---|---|
| Réserves, or compris | 256 Md $US | 3,75 Bn $US |
| Mois d'importations | 4,2 | 13,7 |
| Rang mondial | 17/168 | 1/168 |
| Écart des réserves | 0,068× | 15× |
Comparer les réserves de change de 2 pays au choix
Sources :
- Banque mondiale | Économie et croissance (1960–2025, mis à jour en octobre 2026)
Creative Commons Attribution (CC BY) : vous pouvez copier, partager, adapter et réutiliser ce contenu, y compris à des fins commerciales, à condition de citer statistics.wiki et d’indiquer les modifications apportées. Les sources citées ci-dessus peuvent avoir leurs propres conditions de licence.