
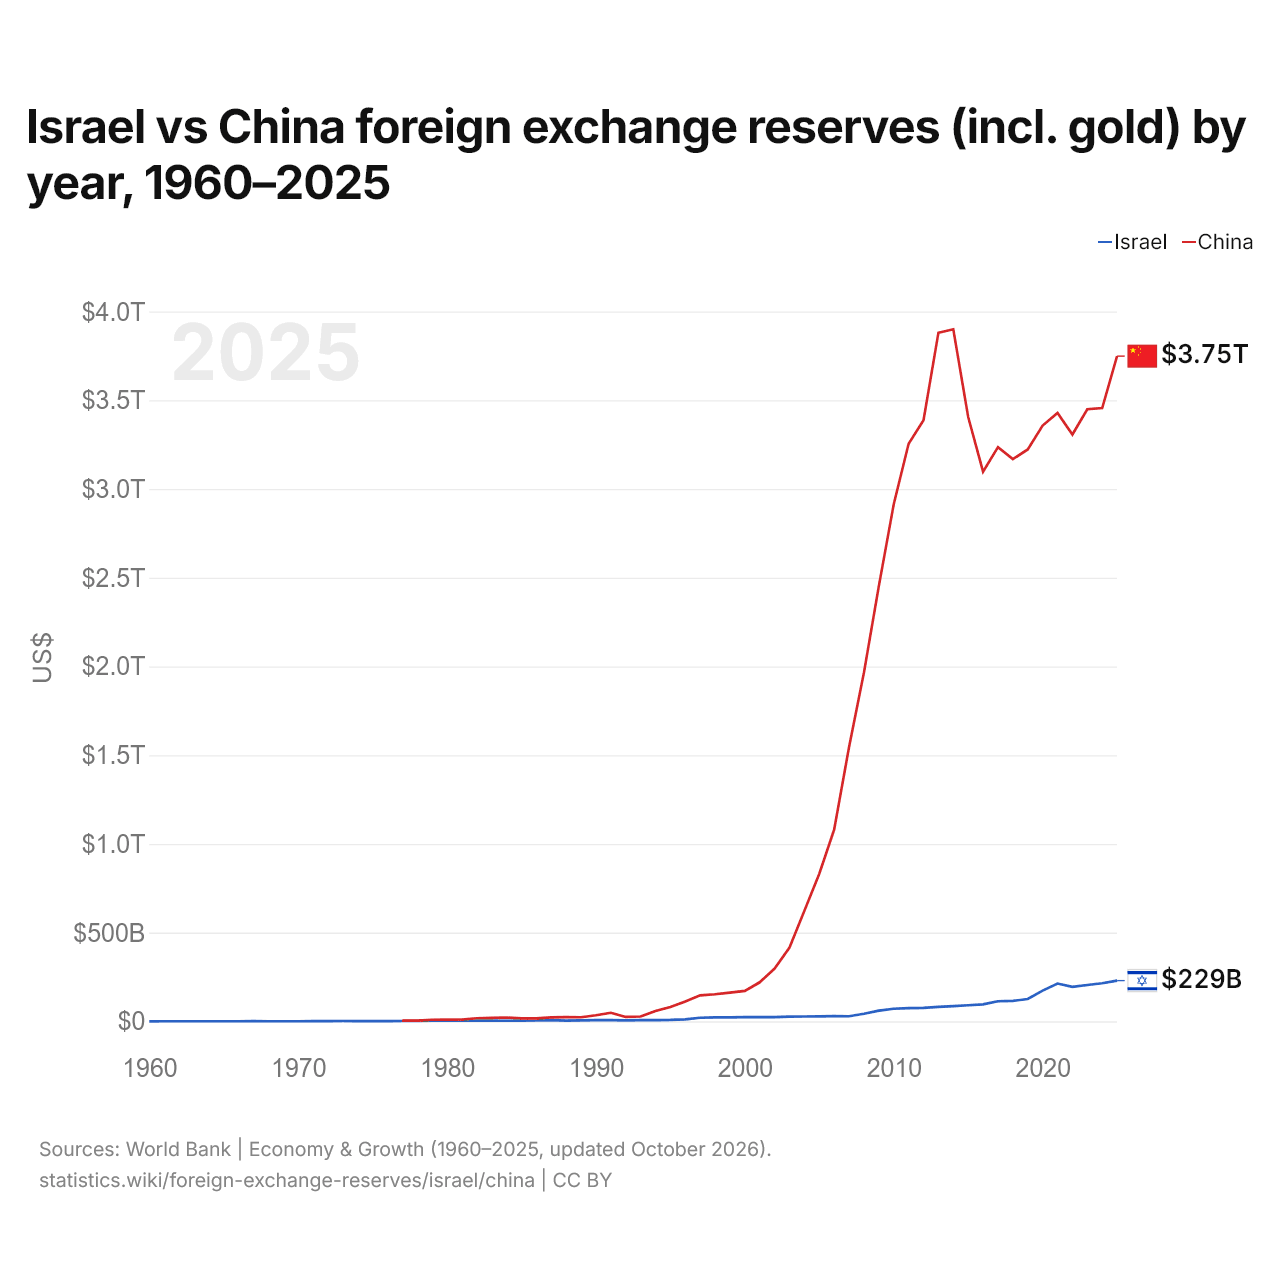
Israël vs Chine : réserves de change (or compris) par année, 1960–2025
| Année | $ US | |
|---|---|---|
 Israël |
 Chine |
|
| 2025 | 229 486 904 239 $ US | 3 748 744 952 818 $ US |
| 2024 | 214 543 676 670 $ US | 3 456 024 808 739 $ US |
| 2023 | 204 660 857 567 $ US | 3 449 544 415 519 $ US |
| 2022 | 194 231 433 878 $ US | 3 306 839 412 814 $ US |
| 2021 | 212 933 655 186 $ US | 3 427 931 394 629 $ US |
| 2020 | 173 292 120 893 $ US | 3 357 240 875 434 $ US |
| 2019 | 126 007 828 810 $ US | 3 222 894 578 036 $ US |
| 2018 | 115 265 900 521 $ US | 3 168 216 331 199 $ US |
| 2017 | 113 009 532 488 $ US | 3 235 681 607 213 $ US |
| 2016 | 95 446 290 282 $ US | 3 097 658 421 378 $ US |
| 2015 | 90 575 018 408 $ US | 3 405 253 363 888 $ US |
| 2014 | 86 101 256 622 $ US | 3 900 039 302 991 $ US |
| 2013 | 81 785 518 233 $ US | 3 880 368 265 253 $ US |
| 2012 | 75 907 618 701 $ US | 3 387 512 973 774 $ US |
| 2011 | 74 874 110 293 $ US | 3 254 674 063 563 $ US |
| 2010 | 70 907 310 771 $ US | 2 913 711 711 315 $ US |
| 2009 | 60 611 355 181 $ US | 2 452 899 062 068 $ US |
| 2008 | 42 513 241 647 $ US | 1 966 037 431 070 $ US |
| 2007 | 28 518 505 747 $ US | 1 546 364 660 543 $ US |
| 2006 | 29 153 237 864 $ US | 1 080 755 682 870 $ US |
| 2005 | 28 059 414 574 $ US | 831 409 619 696 $ US |
| 2004 | 27 094 382 253 $ US | 622 948 544 350 $ US |
| 2003 | 26 315 098 306 $ US | 416 199 411 549 $ US |
| 2002 | 24 082 878 018 $ US | 297 739 475 705 $ US |
| 2001 | 23 378 584 659 $ US | 220 056 777 617 $ US |
| 2000 | 23 281 206 068 $ US | 171 763 098 226 $ US |
| 1999 | 22 604 867 902 $ US | 161 414 049 492 $ US |
| 1998 | 22 674 295 629 $ US | 152 842 955 596 $ US |
| 1997 | 20 334 584 790 $ US | 146 448 007 873 $ US |
| 1996 | 11 417 780 235 $ US | 111 728 900 039 $ US |
| 1995 | 8 122 625 601 $ US | 80 288 427 870 $ US |
| 1994 | 6 795 646 821 $ US | 57 781 337 884 $ US |
| 1993 | 6 386 155 658 $ US | 27 348 104 117 $ US |
| 1992 | 5 130 401 751 $ US | 24 852 636 915 $ US |
| 1991 | 6 427 966 121 $ US | 48 165 019 103 $ US |
| 1990 | 6 598 156 852 $ US | 34 475 661 159 $ US |
| 1989 | 5 684 035 275 $ US | 23 052 566 323 $ US |
| 1988 | 4 433 201 785 $ US | 23 751 513 806 $ US |
| 1987 | 6 368 457 379 $ US | 22 453 016 928 $ US |
| 1986 | 5 057 145 300 $ US | 16 417 429 180 $ US |
| 1985 | 4 012 724 905 $ US | 16 881 047 188 $ US |
| 1984 | 3 373 868 527 $ US | 21 281 443 730 $ US |
| 1983 | 4 038 410 758 $ US | 19 831 702 778 $ US |
| 1982 | 4 334 575 278 $ US | 17 151 500 473 $ US |
| 1981 | 3 970 880 954 $ US | 10 106 339 043 $ US |
| 1980 | 4 055 275 456 $ US | 10 090 779 859 $ US |
| 1979 | 3 693 704 330 $ US | 8 707 600 000 $ US |
| 1978 | 2 889 778 656 $ US | 4 449 800 000 $ US |
| 1977 | 1 713 580 567 $ US | 4 456 360 000 $ US |
| 1976 | 1 476 979 093 $ US | - |
| 1975 | 1 291 503 394 $ US | - |
| 1974 | 1 358 324 375 $ US | - |
| 1973 | 1 891 389 447 $ US | - |
| 1972 | 1 253 027 076 $ US | - |
| 1971 | 743 867 526 $ US | - |
| 1970 | 451 538 800 $ US | - |
| 1969 | 412 671 200 $ US | - |
| 1968 | 672 002 300 $ US | - |
| 1967 | 714 857 200 $ US | - |
| 1966 | 621 344 090 $ US | - |
| 1965 | 643 181 280 $ US | - |
| 1964 | 545 175 920 $ US | - |
| 1963 | 515 211 720 $ US | - |
| 1962 | 419 626 970 $ US | - |
| 1961 | 279 512 900 $ US | - |
| 1960 | 213 156 800 $ US | - |
En 2025, les réserves de change d'Israël s'élevaient à 229 milliards de dollars et celles de la Chine à 3,75 billions de dollars : celles de la Chine étaient 16 fois plus élevées. En 1977, les réserves de la Chine étaient 2,6 fois plus élevées : 1,71 milliard de dollars pour Israël et 4,46 milliards de dollars pour la Chine.
Les réserves de change de la Chine sont supérieures à celles d'Israël chaque année depuis 1977.
Israël vs Chine : réserves, or compris, et mois d'importations couverts
|
Israël
|
Chine
|
|
|---|---|---|
| Réserves, or compris | 229 Md $US | 3,75 Bn $US |
| Mois d'importations | 17,7 | 13,7 |
| Rang mondial | 18/168 | 1/168 |
| Écart des réserves | 0,061× | 16× |
Comparer les réserves de change de 2 pays au choix
Sources :
- Banque mondiale | Économie et croissance (1960–2025, mis à jour en octobre 2026)
Creative Commons Attribution (CC BY) : vous pouvez copier, partager, adapter et réutiliser ce contenu, y compris à des fins commerciales, à condition de citer statistics.wiki et d’indiquer les modifications apportées. Les sources citées ci-dessus peuvent avoir leurs propres conditions de licence.