
Guinea vs Guinea Ecuatorial: gasto militar (US$), 1980–2025
| Año | US$ | |
|---|---|---|
 Guinea |
 Guinea Ecuatorial |
|
| 2025 | 574.846.977 US$ | 115.105.808 US$ |
| 2024 | 543.048.142 US$ | 118.918.548 US$ |
| 2023 | 477.976.179 US$ | 164.877.583 US$ |
| 2022 | 435.771.548 US$ | 156.768.711 US$ |
| 2021 | 263.958.824 US$ | 162.853.007 US$ |
| 2020 | 207.052.838 US$ | 162.340.697 US$ |
| 2019 | 198.040.523 US$ | 148.648.875 US$ |
| 2018 | 198.032.770 US$ | 149.578.753 US$ |
| 2017 | 182.222.876 US$ | 137.740.643 US$ |
| 2016 | 161.776.515 US$ | 139.328.676 US$ |
| 2015 | 221.414.389 US$ | 137.317.987 US$ |
| 2014 | 199.836.496 US$ | 166.762.112 US$ |
| 2013 | 199.881.437 US$ | - |
| 2012 | 171.480.773 US$ | - |
| 2011 | - | - |
| 2010 | - | - |
| 2009 | - | 371.927.352 US$ |
| 2008 | - | 292.754.463 US$ |
| 2007 | - | 196.314.454 US$ |
| 2006 | - | - |
| 2005 | - | - |
| 2004 | 118.131.028 US$ | - |
| 2003 | 122.673.467 US$ | - |
| 2002 | 143.014.736 US$ | - |
| 2001 | 127.900.042 US$ | - |
| 2000 | 67.024.662 US$ | - |
| 1999 | 80.503.187 US$ | - |
| 1998 | 65.662.653 US$ | - |
| 1997 | 64.703.455 US$ | - |
| 1996 | - | - |
| 1995 | - | 2.901.776 US$ |
| 1994 | 66.894.540 US$ | 2.002.454 US$ |
| 1993 | 64.101.542 US$ | - |
| 1992 | 81.160.074 US$ | - |
| 1991 | 104.653.419 US$ | - |
| 1990 | - | - |
| 1989 | - | - |
| 1988 | - | - |
| 1987 | - | - |
| 1986 | - | - |
| 1985 | - | - |
| 1984 | - | - |
| 1983 | - | - |
| 1982 | 76.220.304 US$ | - |
| 1981 | 76.576.180 US$ | - |
| 1980 | 87.948.513 US$ | - |
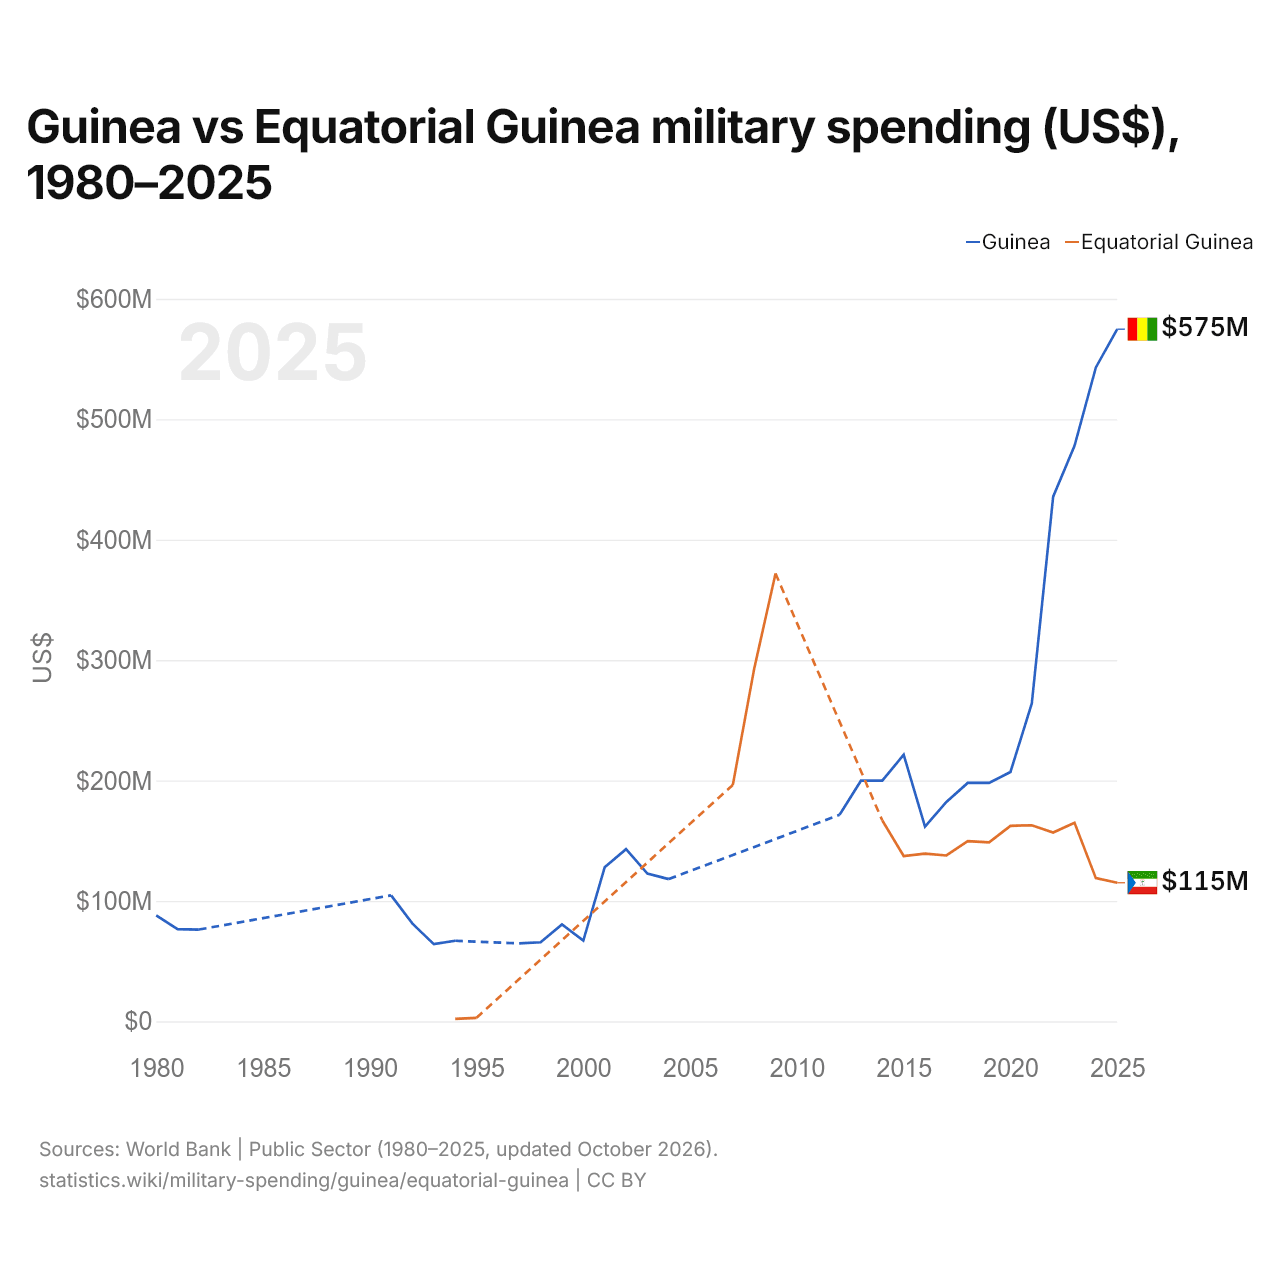
En 2025, el gasto militar fue de 575 millones de US$ en Guinea y de 115 millones de US$ en Guinea Ecuatorial: 5,0 veces más en Guinea. En 1994 fue de 66,9 millones de US$ en Guinea y de 2 millones de US$ en Guinea Ecuatorial, 33 veces más en Guinea.
Guinea vs Guinea Ecuatorial: gasto militar en % del PIB, 1980–2025
| Año | % del PIB | |
|---|---|---|
|
Guinea
|
Guinea Ecuatorial
|
|
| 2025 | 2 % | 0,9 % |
| 2024 | 2,2 % | 0,9 % |
| 2023 | 2,1 % | 1,3 % |
| 2022 | 2,2 % | 1,1 % |
| 2021 | 1,5 % | 1,3 % |
| 2020 | 1,5 % | 1,6 % |
| 2019 | 1,5 % | 1,3 % |
| 2018 | 1,7 % | 1,1 % |
| 2017 | 1,8 % | 1,1 % |
| 2016 | 1,9 % | 1,2 % |
| 2015 | 2,5 % | 1 % |
| 2014 | 2,3 % | 0,8 % |
| 2013 | 2,4 % | - |
| 2012 | 2,2 % | - |
| 2011 | - | - |
| 2010 | - | - |
| 2009 | - | 2,5 % |
| 2008 | - | 1,5 % |
| 2007 | - | 1,5 % |
| 2006 | - | - |
| 2005 | - | - |
| 2004 | 2,2 % | - |
| 2003 | 2,4 % | - |
| 2002 | 3,3 % | - |
| 2001 | 3,1 % | - |
| 2000 | 1,5 % | - |
| 1999 | 1,6 % | - |
| 1998 | 1,3 % | - |
| 1997 | 1,2 % | - |
| 1996 | - | - |
| 1995 | - | 2 % |
| 1994 | 1,4 % | 2 % |
| 1993 | 1,3 % | - |
| 1992 | 1,7 % | - |
| 1991 | 2,4 % | - |
| 1990 | - | - |
| 1989 | - | - |
| 1988 | - | - |
| 1987 | - | - |
| 1986 | - | - |
| 1985 | - | - |
| 1984 | - | - |
| 1983 | - | - |
| 1982 | 0,6 % | - |
| 1981 | 0,8 % | - |
| 1980 | 0,9 % | - |
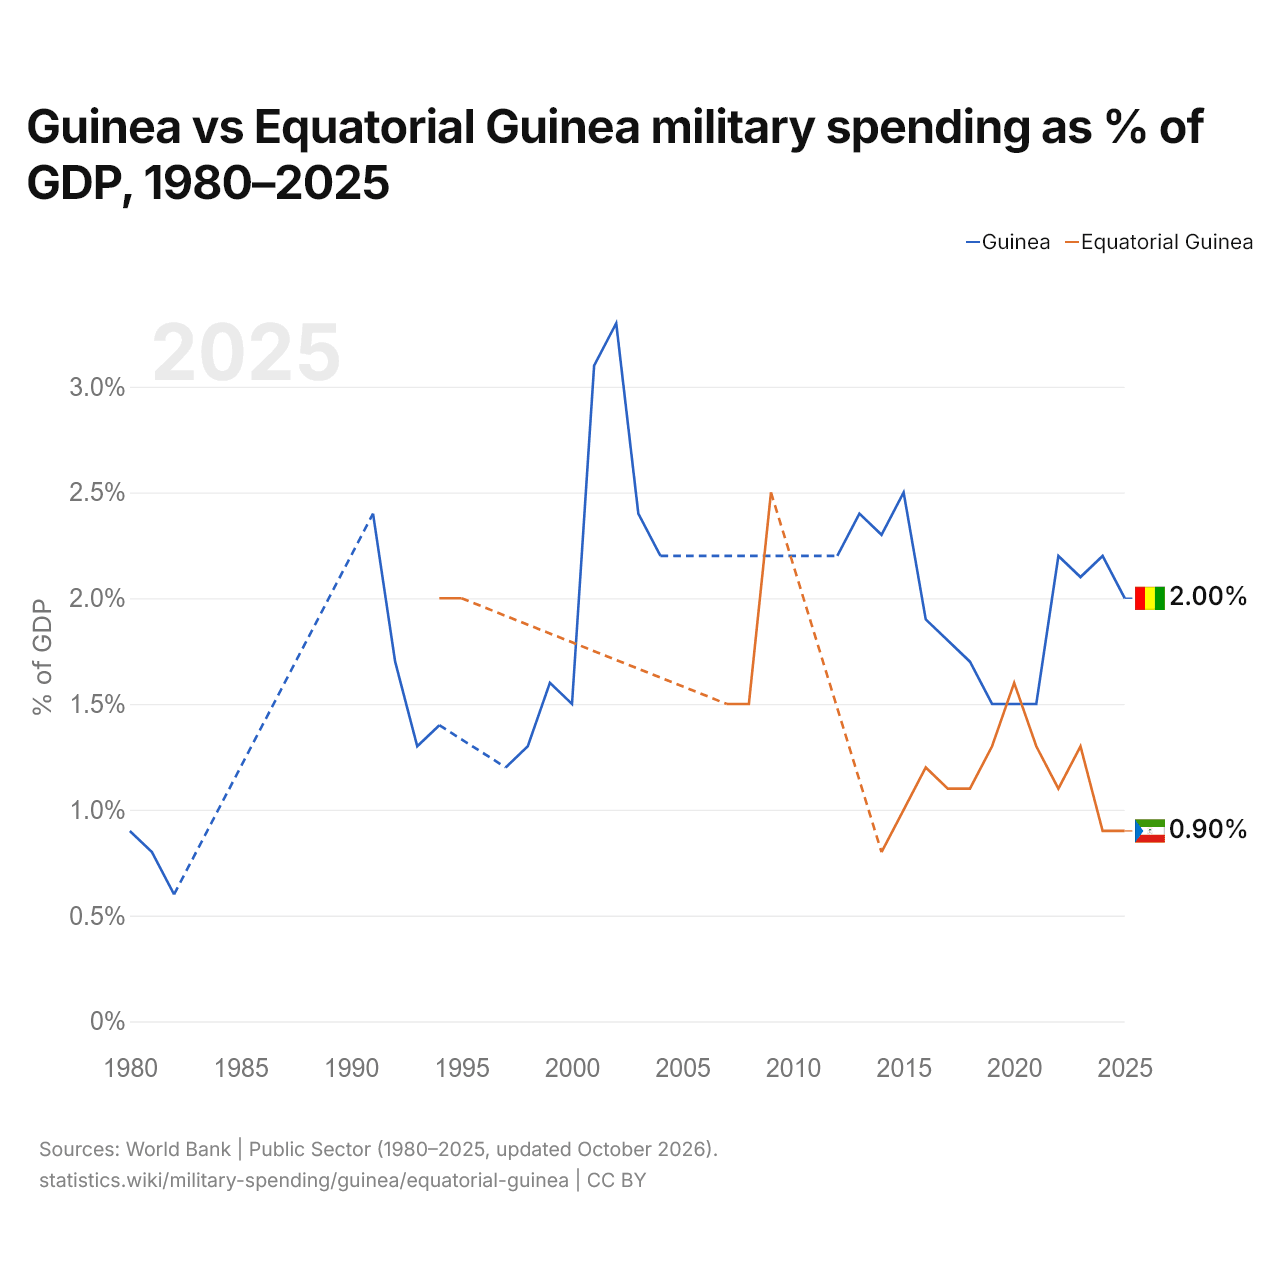
En 2025, el gasto militar fue del 2,0 % del PIB en Guinea y del 0,9 % en Guinea Ecuatorial: 1,1 puntos porcentuales más en Guinea. En 2015 fue del 2,5 % en Guinea y del 1,0 % en Guinea Ecuatorial, 1,5 puntos porcentuales más en Guinea.
El gasto militar de Guinea, como porcentaje del PIB, ha sido más alto que el de Guinea Ecuatorial todos los años desde 2021. La diferencia fue máxima en 2014, cuando el gasto militar de Guinea superó al de Guinea Ecuatorial en 1,5 puntos porcentuales del PIB.
Guinea vs Guinea Ecuatorial: datos del gasto militar
|
Guinea
|
Guinea Ecuatorial
|
|
|---|---|---|
| US$, 2025 | 575 M US$ | 115 M US$ |
| % del PIB, 2025 | 2,0 % | 0,9 % |
| Por persona, US$ | 38,1 US$ | 59,4 US$ |
| Porcentaje del mundo | 0,02 % | 0,004 % |
| Puesto mundial | 102/154 | 135/154 |
Comparar el gasto militar de 2 países cualesquiera
Fuentes:
- Banco Mundial | Sector público (1980–2025, actualizado en octubre de 2026)
Creative Commons Atribución (CC BY): puedes copiar, compartir, adaptar y reutilizar este contenido, también con fines comerciales, siempre que cites a statistics.wiki e indiques los cambios que hayas hecho. Las fuentes indicadas arriba pueden tener sus propias condiciones de licencia.