
Guinea-Bisáu vs Guinea: gasto militar (US$), 1980–2025
| Año | US$ | |
|---|---|---|
 Guinea-Bisáu |
 Guinea |
|
| 2025 | 22.423.918 US$ | 574.846.977 US$ |
| 2024 | 22.853.872 US$ | 543.048.142 US$ |
| 2023 | 18.521.809 US$ | 477.976.179 US$ |
| 2022 | 19.777.787 US$ | 435.771.548 US$ |
| 2021 | 27.774.176 US$ | 263.958.824 US$ |
| 2020 | 25.828.497 US$ | 207.052.838 US$ |
| 2019 | 23.707.477 US$ | 198.040.523 US$ |
| 2018 | 10.744.962 US$ | 198.032.770 US$ |
| 2017 | 19.381.502 US$ | 182.222.876 US$ |
| 2016 | 15.744.535 US$ | 161.776.515 US$ |
| 2015 | 17.043.810 US$ | 221.414.389 US$ |
| 2014 | 21.499.428 US$ | 199.836.496 US$ |
| 2013 | 21.716.963 US$ | 199.881.437 US$ |
| 2012 | 24.490.362 US$ | 171.480.773 US$ |
| 2011 | 17.542.757 US$ | - |
| 2010 | 17.146.521 US$ | - |
| 2009 | 13.799.895 US$ | - |
| 2008 | - | - |
| 2007 | - | - |
| 2006 | - | - |
| 2005 | 12.121.192 US$ | - |
| 2004 | - | 118.131.028 US$ |
| 2003 | 8.721.776 US$ | 122.673.467 US$ |
| 2002 | 7.275.149 US$ | 143.014.736 US$ |
| 2001 | 6.712.052 US$ | 127.900.042 US$ |
| 2000 | 10.284.681 US$ | 67.024.662 US$ |
| 1999 | - | 80.503.187 US$ |
| 1998 | 8.302.622 US$ | 65.662.653 US$ |
| 1997 | 4.541.335 US$ | 64.703.455 US$ |
| 1996 | 3.982.952 US$ | - |
| 1995 | 3.271.718 US$ | - |
| 1994 | 1.947.542 US$ | 66.894.540 US$ |
| 1993 | - | 64.101.542 US$ |
| 1992 | - | 81.160.074 US$ |
| 1991 | - | 104.653.419 US$ |
| 1990 | - | - |
| 1989 | 1.003.342 US$ | - |
| 1988 | - | - |
| 1987 | 262.491 US$ | - |
| 1986 | 82.588 US$ | - |
| 1985 | 40.773 US$ | - |
| 1984 | 54.084 US$ | - |
| 1983 | 57.313 US$ | - |
| 1982 | 37.411 US$ | 76.220.304 US$ |
| 1981 | - | 76.576.180 US$ |
| 1980 | - | 87.948.513 US$ |
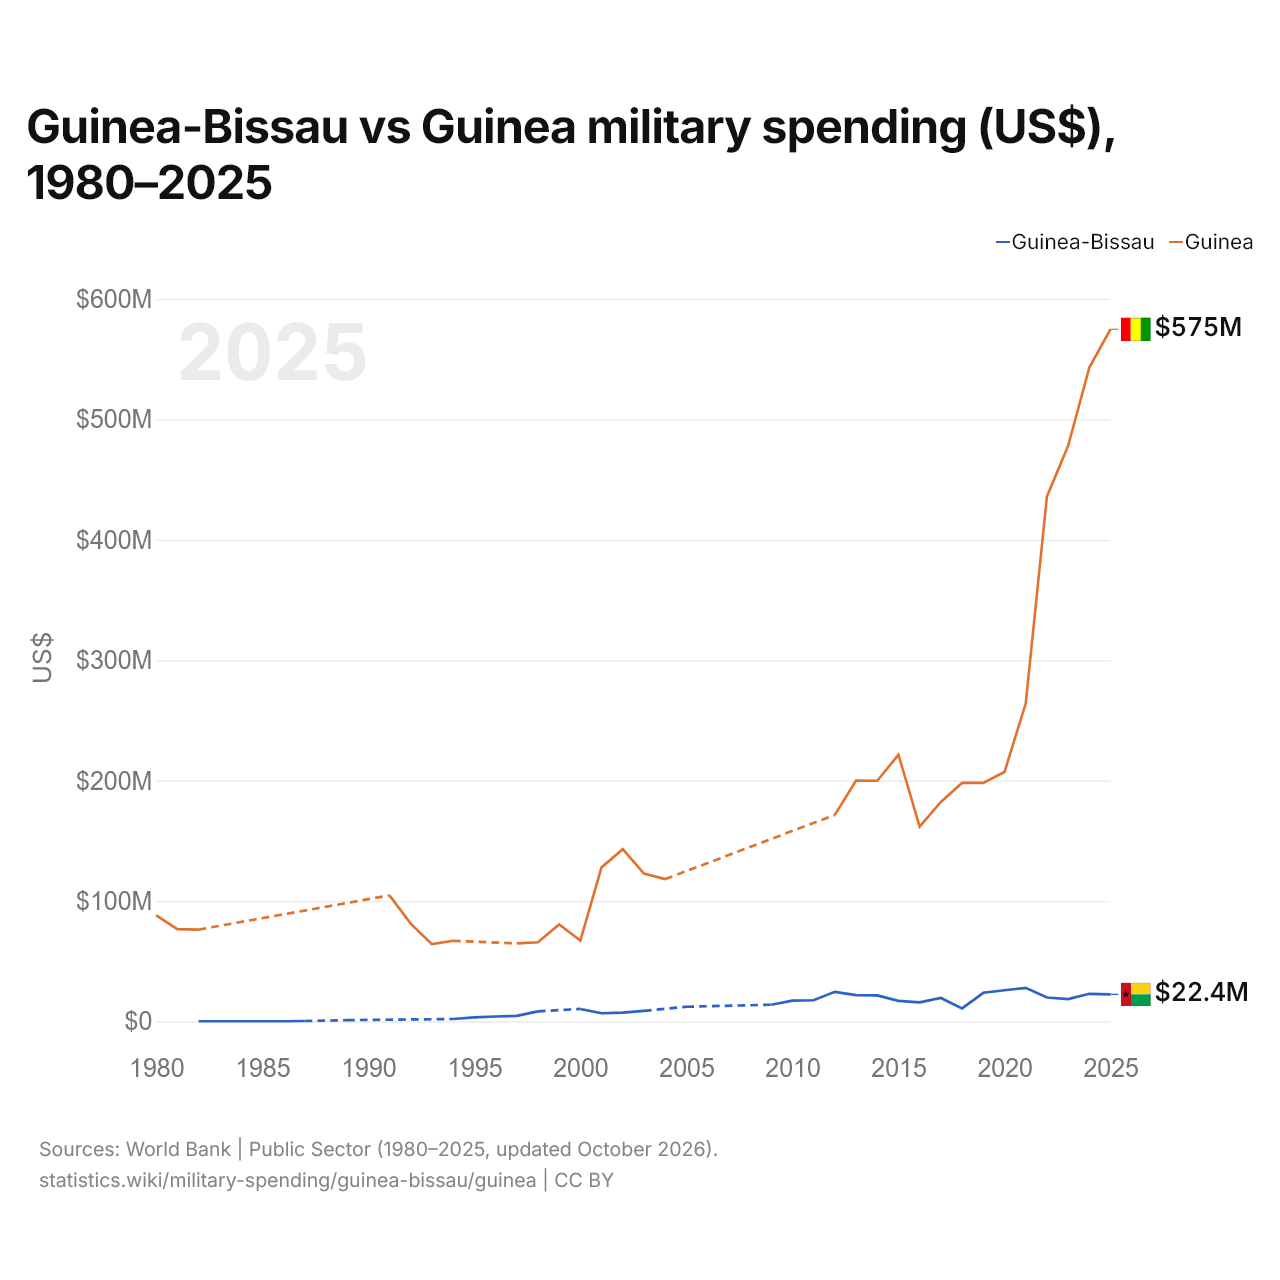
En 2025, el gasto militar fue de 22,4 millones de US$ en Guinea-Bisáu y de 575 millones de US$ en Guinea: 26 veces más en Guinea. En 1982 fue de 37.400 US$ en Guinea-Bisáu y de 76,2 millones de US$ en Guinea, 2000 veces más en Guinea.
Guinea-Bisáu vs Guinea: gasto militar en % del PIB, 1980–2025
| Año | % del PIB | |
|---|---|---|
|
Guinea-Bisáu
|
Guinea
|
|
| 2025 | 0,9 % | 2 % |
| 2024 | 1 % | 2,2 % |
| 2023 | 0,9 % | 2,1 % |
| 2022 | 1,1 % | 2,2 % |
| 2021 | 1,5 % | 1,5 % |
| 2020 | 1,5 % | 1,5 % |
| 2019 | 1,5 % | 1,5 % |
| 2018 | 0,7 % | 1,7 % |
| 2017 | 1,3 % | 1,8 % |
| 2016 | 1,3 % | 1,9 % |
| 2015 | 1,5 % | 2,5 % |
| 2014 | 1,9 % | 2,3 % |
| 2013 | 2 % | 2,4 % |
| 2012 | 2,3 % | 2,2 % |
| 2011 | 1,5 % | - |
| 2010 | 1,8 % | - |
| 2009 | 1,6 % | - |
| 2008 | - | - |
| 2007 | - | - |
| 2006 | - | - |
| 2005 | 1,9 % | - |
| 2004 | - | 2,2 % |
| 2003 | 1,6 % | 2,4 % |
| 2002 | 1,6 % | 3,3 % |
| 2001 | 1,6 % | 3,1 % |
| 2000 | 2,6 % | 1,5 % |
| 1999 | - | 1,6 % |
| 1998 | 1,4 % | 1,3 % |
| 1997 | 0,7 % | 1,2 % |
| 1996 | 0,6 % | - |
| 1995 | 0,5 % | - |
| 1994 | 0,3 % | 1,4 % |
| 1993 | - | 1,3 % |
| 1992 | - | 1,7 % |
| 1991 | - | 2,4 % |
| 1990 | - | - |
| 1989 | 0,2 % | - |
| 1988 | - | - |
| 1987 | 0,1 % | - |
| 1986 | 0 % | - |
| 1985 | 0 % | - |
| 1984 | 0 % | - |
| 1983 | 0 % | - |
| 1982 | 0 % | 0,6 % |
| 1981 | - | 0,8 % |
| 1980 | - | 0,9 % |
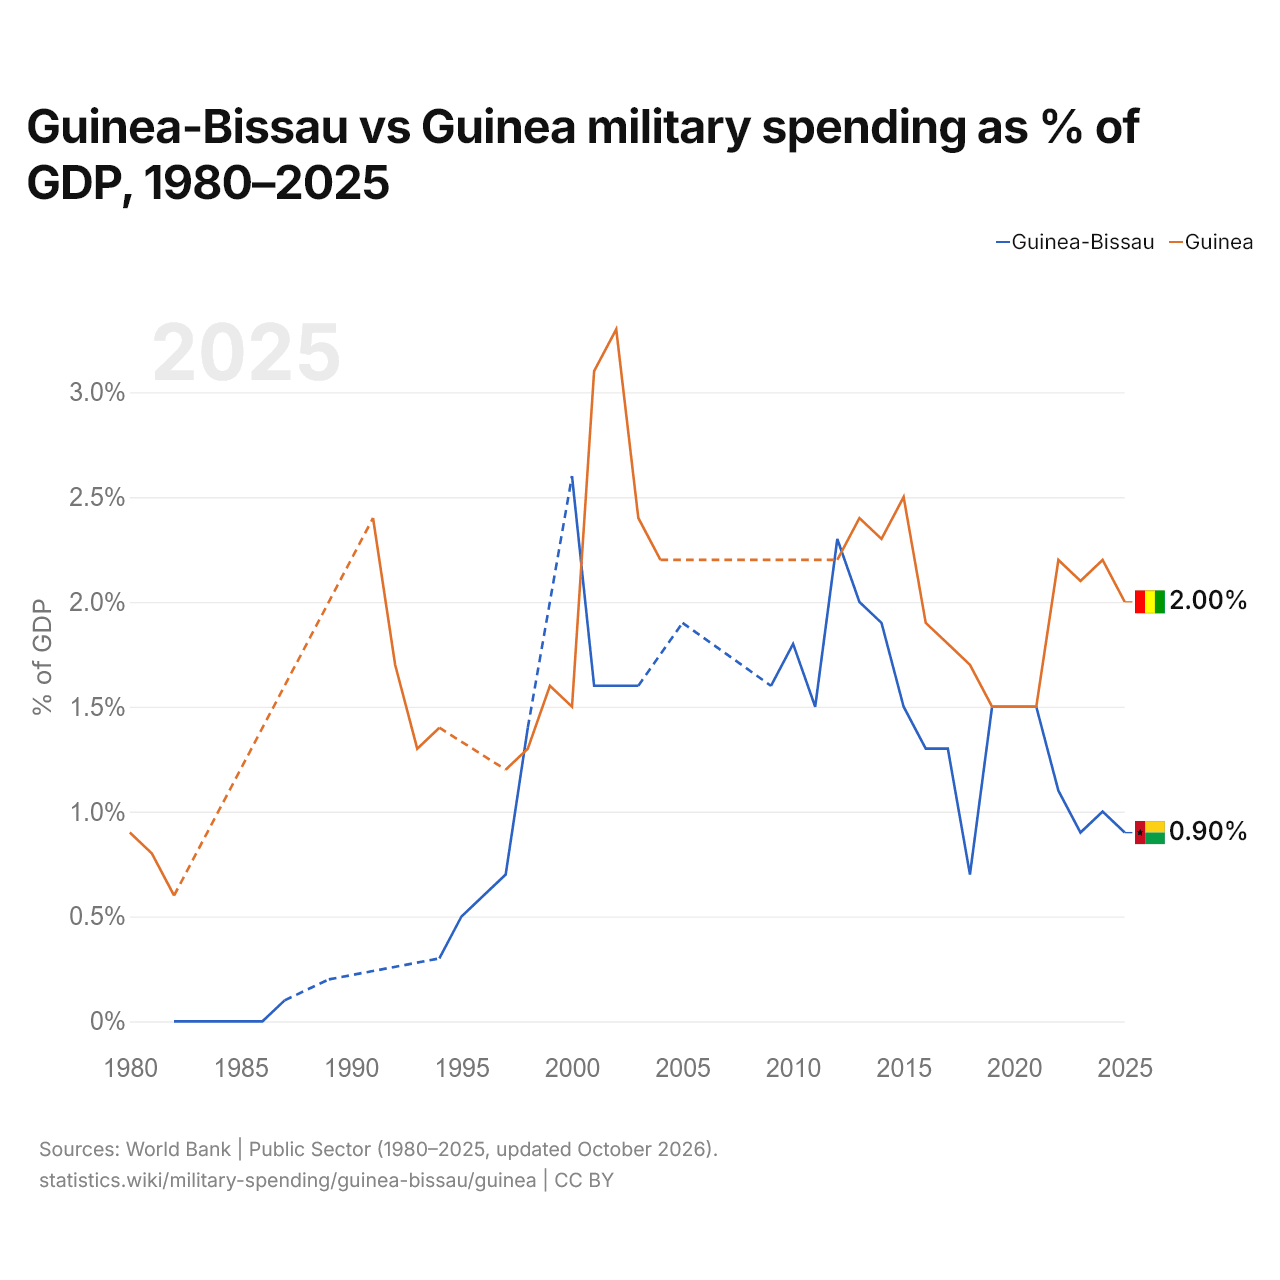
En 2025, el gasto militar fue del 0,9 % del PIB en Guinea-Bisáu y del 2,0 % en Guinea: 1,1 puntos porcentuales más en Guinea. En 2015 fue del 1,5 % en Guinea-Bisáu y del 2,5 % en Guinea, 1,0 puntos porcentuales más en Guinea.
El gasto militar de Guinea, como porcentaje del PIB, ha sido más alto que el de Guinea-Bisáu todos los años desde 2022. La diferencia fue máxima en 2002, cuando el gasto militar de Guinea superó al de Guinea-Bisáu en 1,7 puntos porcentuales del PIB.
Guinea-Bisáu vs Guinea: datos del gasto militar
|
Guinea-Bisáu
|
Guinea
|
|
|---|---|---|
| US$, 2025 | 22,4 M US$ | 575 M US$ |
| % del PIB, 2025 | 0,9 % | 2,0 % |
| Por persona, US$ | 9,97 US$ | 38,1 US$ |
| Porcentaje del mundo | <0,001 % | 0,02 % |
| Puesto mundial | 150/154 | 102/154 |
Comparar el gasto militar de 2 países cualesquiera
Fuentes:
- Banco Mundial | Sector público (1980–2025, actualizado en octubre de 2026)
Creative Commons Atribución (CC BY): puedes copiar, compartir, adaptar y reutilizar este contenido, también con fines comerciales, siempre que cites a statistics.wiki e indiques los cambios que hayas hecho. Las fuentes indicadas arriba pueden tener sus propias condiciones de licencia.