
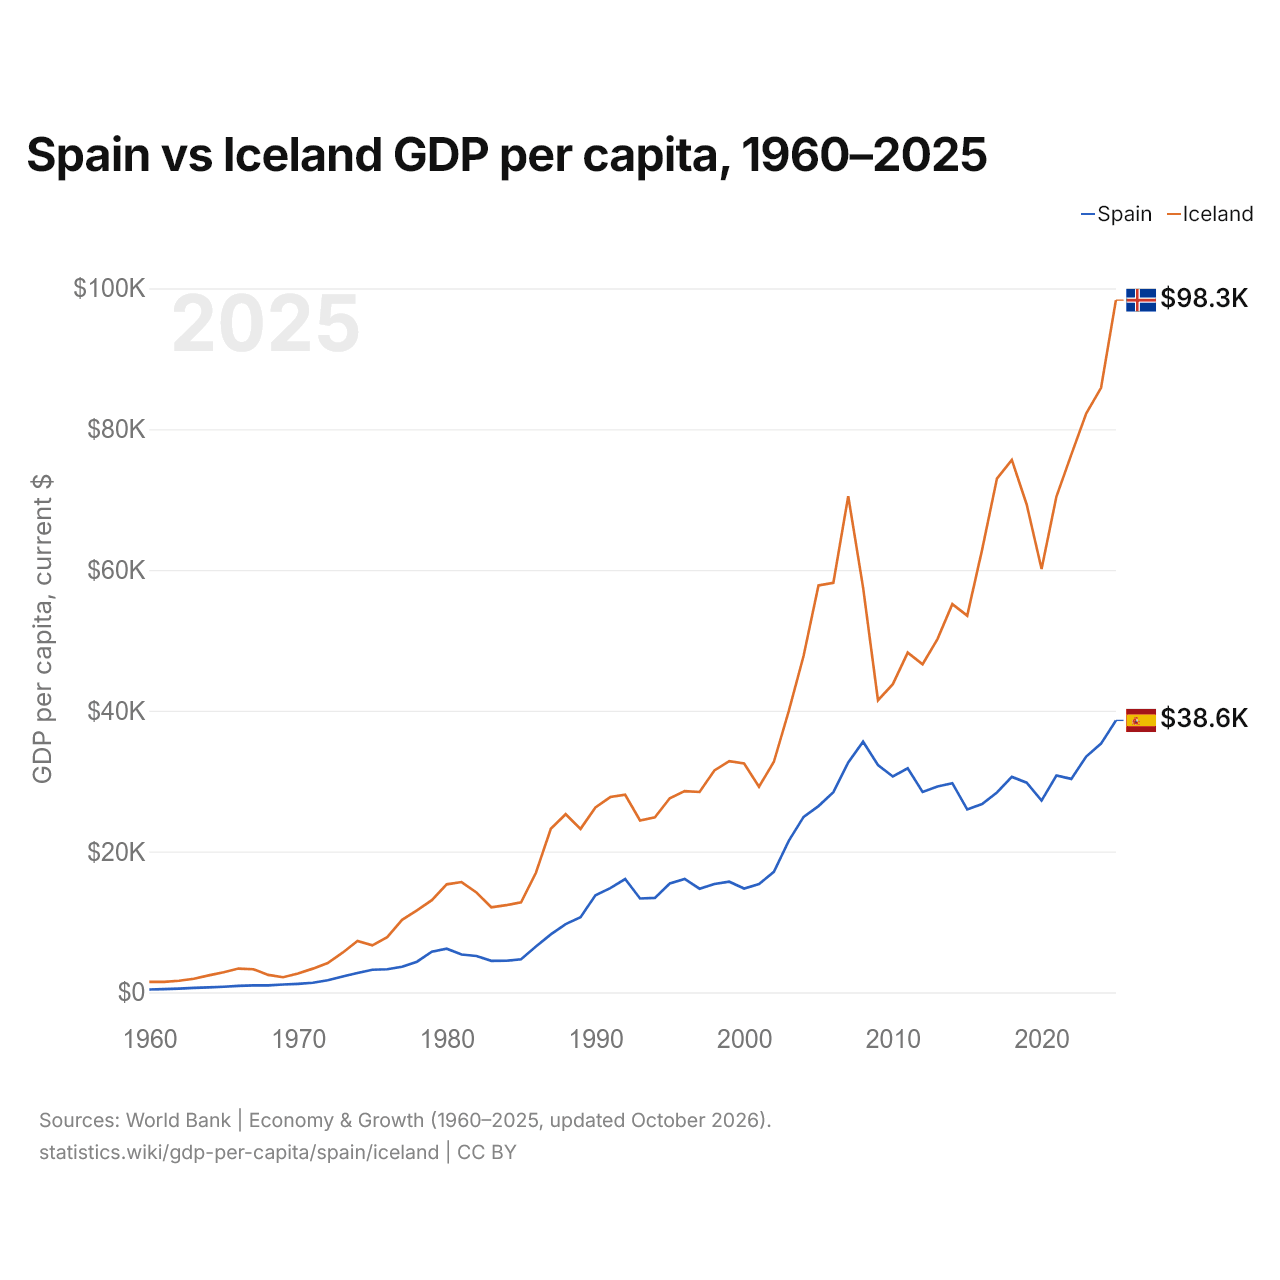
España vs Islandia: PIB per cápita, 1960–2025
| Año | PIB per cápita, US$ corrientes | |
|---|---|---|
 España |
 Islandia |
|
| 2025 | 38.627 US$ | 98.323 US$ |
| 2024 | 35.327 US$ | 85.863 US$ |
| 2023 | 33.493 US$ | 82.201 US$ |
| 2022 | 30.319 US$ | 76.377 US$ |
| 2021 | 30.799 US$ | 70.425 US$ |
| 2020 | 27.234 US$ | 60.128 US$ |
| 2019 | 29.787 US$ | 69.296 US$ |
| 2018 | 30.602 US$ | 75.634 US$ |
| 2017 | 28.381 US$ | 72.976 US$ |
| 2016 | 26.756 US$ | 62.854 US$ |
| 2015 | 25.982 US$ | 53.506 US$ |
| 2014 | 29.708 US$ | 55.140 US$ |
| 2013 | 29.229 US$ | 50.173 US$ |
| 2012 | 28.456 US$ | 46.595 US$ |
| 2011 | 31.825 US$ | 48.255 US$ |
| 2010 | 30.659 US$ | 43.776 US$ |
| 2009 | 32.280 US$ | 41.484 US$ |
| 2008 | 35.603 US$ | 57.489 US$ |
| 2007 | 32.652 US$ | 70.483 US$ |
| 2006 | 28.422 US$ | 58.172 US$ |
| 2005 | 26.451 US$ | 57.784 US$ |
| 2004 | 24.925 US$ | 47.810 US$ |
| 2003 | 21.522 US$ | 39.944 US$ |
| 2002 | 17.111 US$ | 32.749 US$ |
| 2001 | 15.368 US$ | 29.208 US$ |
| 2000 | 14.743 US$ | 32.504 US$ |
| 1999 | 15.708 US$ | 32.834 US$ |
| 1998 | 15.382 US$ | 31.519 US$ |
| 1997 | 14.722 US$ | 28.462 US$ |
| 1996 | 16.101 US$ | 28.584 US$ |
| 1995 | 15.461 US$ | 27.565 US$ |
| 1994 | 13.406 US$ | 24.858 US$ |
| 1993 | 13.330 US$ | 24.404 US$ |
| 1992 | 16.101 US$ | 28.072 US$ |
| 1991 | 14.801 US$ | 27.740 US$ |
| 1990 | 13.795 US$ | 26.272 US$ |
| 1989 | 10.674 US$ | 23.219 US$ |
| 1988 | 9.696 US$ | 25.307 US$ |
| 1987 | 8.234 US$ | 23.238 US$ |
| 1986 | 6.509 US$ | 16.980 US$ |
| 1985 | 4.696 US$ | 12.793 US$ |
| 1984 | 4.487 US$ | 12.378 US$ |
| 1983 | 4.475 US$ | 12.080 US$ |
| 1982 | 5.156 US$ | 14.191 US$ |
| 1981 | 5.367 US$ | 15.666 US$ |
| 1980 | 6.204 US$ | 15.340 US$ |
| 1979 | 5.766 US$ | 13.082 US$ |
| 1978 | 4.353 US$ | 11.630 US$ |
| 1977 | 3.625 US$ | 10.305 US$ |
| 1976 | 3.277 US$ | 7.848 US$ |
| 1975 | 3.208 US$ | 6.680 US$ |
| 1974 | 2.748 US$ | 7.287 US$ |
| 1973 | 2.246 US$ | 5.627 US$ |
| 1972 | 1.708 US$ | 4.155 US$ |
| 1971 | 1.361 US$ | 3.366 US$ |
| 1970 | 1.211 US$ | 2.666 US$ |
| 1969 | 1.109 US$ | 2.142 US$ |
| 1968 | 978 US$ | 2.473 US$ |
| 1967 | 997 US$ | 3.284 US$ |
| 1966 | 916 US$ | 3.378 US$ |
| 1965 | 797 US$ | 2.861 US$ |
| 1964 | 695 US$ | 2.414 US$ |
| 1963 | 627 US$ | 1.924 US$ |
| 1962 | 535 US$ | 1.641 US$ |
| 1961 | 463 US$ | 1.490 US$ |
| 1960 | 408 US$ | 1.486 US$ |
En 2025, el PIB per cápita fue de 38.627 US$ en España y de 98.323 US$ en Islandia: 2,5 veces más alto en Islandia. En 1960 era de 408 US$ en España y de 1486 US$ en Islandia, 3,6 veces más alto en Islandia.
El PIB per cápita de Islandia ha sido más alto que el de España todos los años desde 1960. A precios constantes de 2015, el PIB per cápita de España en 2025 fue 4,7 veces el de 1960, y el de Islandia, 4,1 veces.
España vs Islandia: últimos datos del PIB per cápita
|
España
|
Islandia
|
|
|---|---|---|
| PIB per cápita, US$ corrientes | 38.627 US$ | 98.323 US$ |
| Puesto mundial | 32/197 | 8/197 |
| PIB per cápita, US$ constantes de 2015 | 29.763 US$ | 58.910 US$ |
| × media mundial | 2,68× | 6,83× |
| Diferencia de PIB per cápita | 0,39× | 2,5× |
Comparar el PIB per cápita de 2 países cualesquiera
Fuentes:
- Banco Mundial | Economía y crecimiento (1960–2025, actualizado en octubre de 2026)
Creative Commons Atribución (CC BY): puedes copiar, compartir, adaptar y reutilizar este contenido, también con fines comerciales, siempre que cites a statistics.wiki e indiques los cambios que hayas hecho. Las fuentes indicadas arriba pueden tener sus propias condiciones de licencia.