
Poland vs Chad carbon intensity of GDP (kg CO2 per $, PPP, 2021 prices)
1x
| Year | kg CO2 per $ | |
|---|---|---|
 Poland |
 Chad |
|
| 2024 | 0.167 kg | 0.059 kg |
| 2023 | 0.175 kg | 0.062 kg |
| 2022 | 0.193 kg | 0.063 kg |
| 2021 | 0.213 kg | 0.063 kg |
| 2020 | 0.209 kg | 0.056 kg |
| 2019 | 0.215 kg | 0.054 kg |
| 2018 | 0.238 kg | 0.059 kg |
| 2017 | 0.253 kg | 0.057 kg |
| 2016 | 0.255 kg | 0.043 kg |
| 2015 | 0.254 kg | 0.039 kg |
| 2014 | 0.262 kg | 0.035 kg |
| 2013 | 0.284 kg | 0.034 kg |
| 2012 | 0.29 kg | 0.032 kg |
| 2011 | 0.301 kg | 0.02 kg |
| 2010 | 0.319 kg | 0.016 kg |
| 2009 | 0.311 kg | 0.017 kg |
| 2008 | 0.333 kg | 0.016 kg |
| 2007 | 0.354 kg | 0.02 kg |
| 2006 | 0.378 kg | 0.018 kg |
| 2005 | 0.385 kg | 0.017 kg |
| 2004 | 0.398 kg | 0.019 kg |
| 2003 | 0.416 kg | 0.022 kg |
| 2002 | 0.413 kg | 0.017 kg |
| 2001 | 0.431 kg | 0.017 kg |
| 2000 | 0.441 kg | 0.019 kg |
| 1999 | 0.478 kg | 0.013 kg |
| 1998 | 0.515 kg | 0.012 kg |
| 1997 | 0.585 kg | 0.013 kg |
| 1996 | 0.639 kg | 0.013 kg |
| 1995 | 0.649 kg | 0.013 kg |
| 1994 | 0.697 kg | 0.013 kg |
| 1993 | 0.747 kg | 0.013 kg |
| 1992 | 0.774 kg | 0.021 kg |
| 1991 | 0.813 kg | 0.026 kg |
| 1990 | 0.76 kg | 0.023 kg |
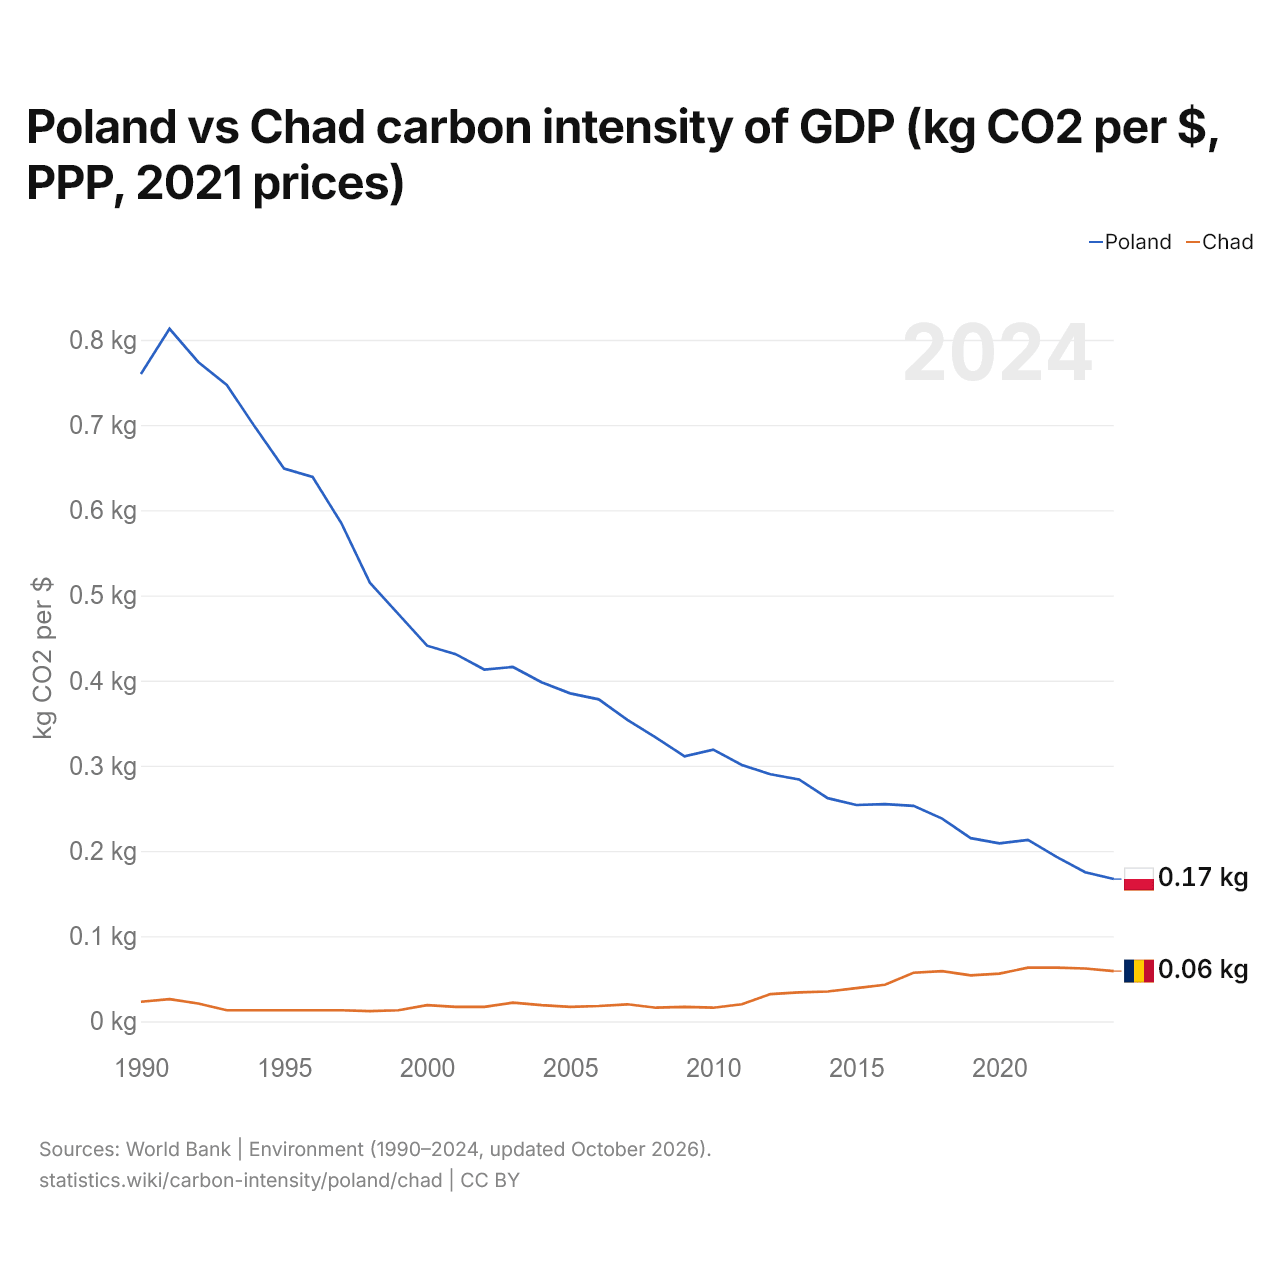
Carbon intensity is 0.167 kg of CO2 per dollar of GDP in Poland and 0.059 kg in Chad: 0.108 kg more in Poland. In 1990, Poland emitted 0.760 kg and Chad 0.023 kg, a difference of 0.737 kg.
Poland's carbon intensity has been higher than Chad's every year since 1990. The gap was widest in 1991, when Poland's carbon intensity was 0.787 kg above Chad's.
Poland vs Chad: latest carbon intensity of GDP
Compare the carbon intensity of GDP of any 2 countries
Sources:
- World Bank | Environment (1990–2024, updated October 2026)
Creative Commons Attribution (CC BY): you may copy, share, adapt and reuse this content, also commercially, as long as you credit statistics.wiki and note any changes you made. The sources listed above may have their own license terms.