
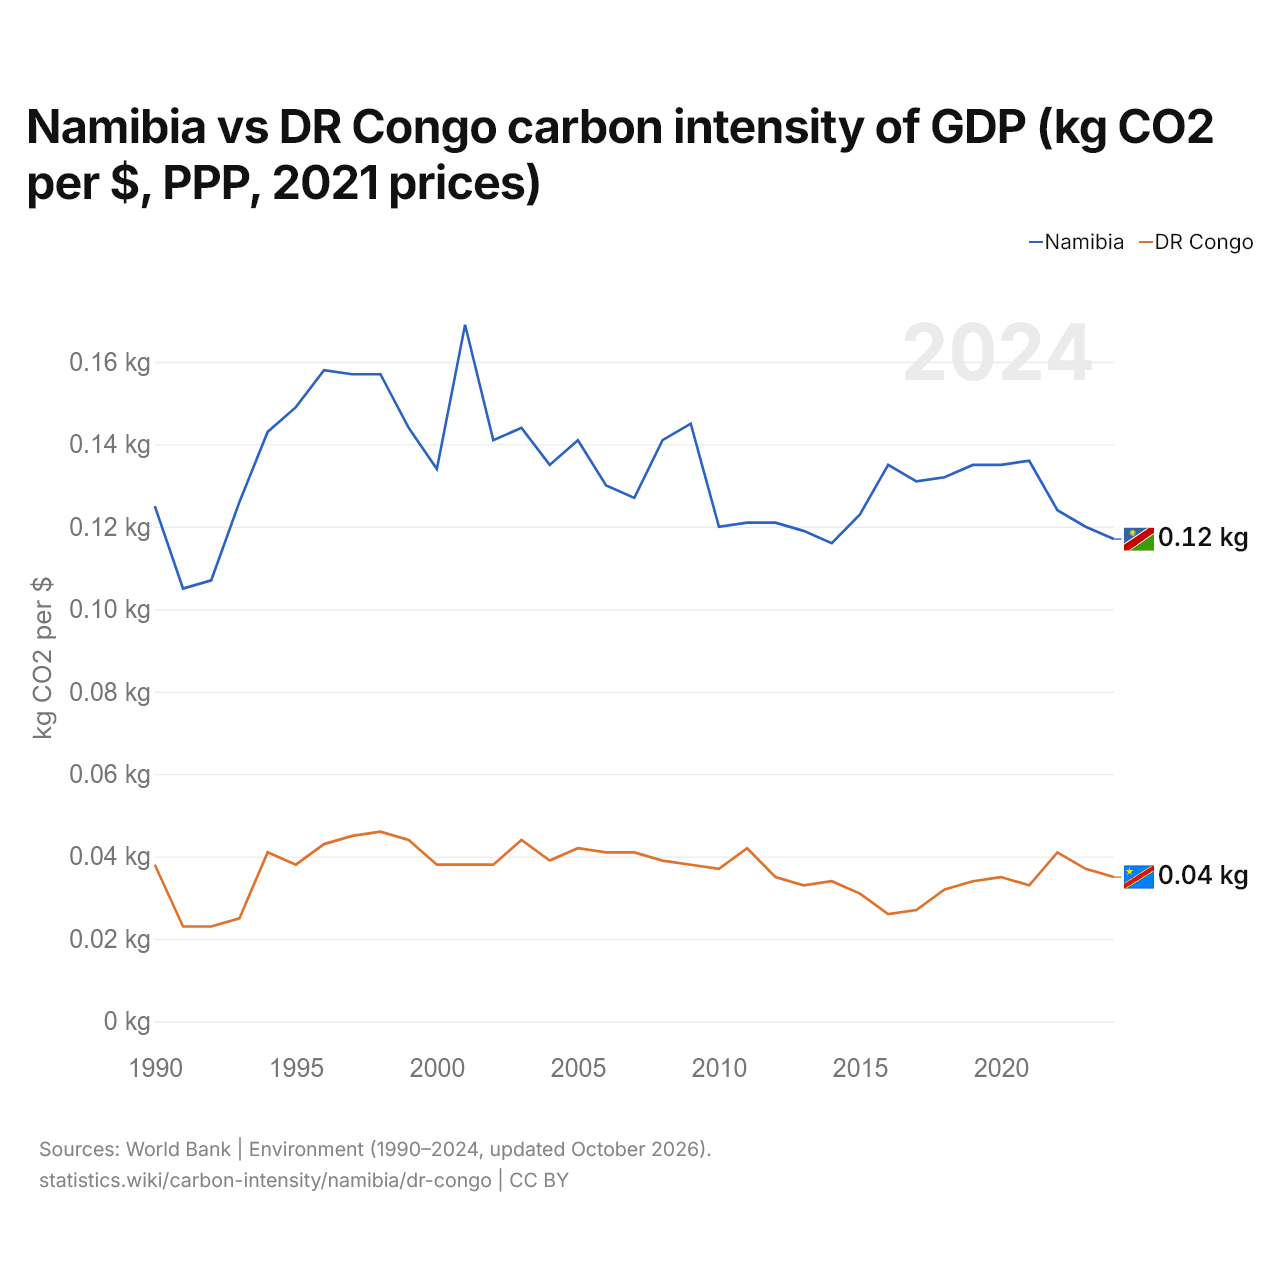
Namibia vs DR Congo carbon intensity of GDP (kg CO2 per $, PPP, 2021 prices)
1x
| Year | kg CO2 per $ | |
|---|---|---|
 Namibia |
 DR Congo |
|
| 2024 | 0.117 kg | 0.035 kg |
| 2023 | 0.12 kg | 0.037 kg |
| 2022 | 0.124 kg | 0.041 kg |
| 2021 | 0.136 kg | 0.033 kg |
| 2020 | 0.135 kg | 0.035 kg |
| 2019 | 0.135 kg | 0.034 kg |
| 2018 | 0.132 kg | 0.032 kg |
| 2017 | 0.131 kg | 0.027 kg |
| 2016 | 0.135 kg | 0.026 kg |
| 2015 | 0.123 kg | 0.031 kg |
| 2014 | 0.116 kg | 0.034 kg |
| 2013 | 0.119 kg | 0.033 kg |
| 2012 | 0.121 kg | 0.035 kg |
| 2011 | 0.121 kg | 0.042 kg |
| 2010 | 0.12 kg | 0.037 kg |
| 2009 | 0.145 kg | 0.038 kg |
| 2008 | 0.141 kg | 0.039 kg |
| 2007 | 0.127 kg | 0.041 kg |
| 2006 | 0.13 kg | 0.041 kg |
| 2005 | 0.141 kg | 0.042 kg |
| 2004 | 0.135 kg | 0.039 kg |
| 2003 | 0.144 kg | 0.044 kg |
| 2002 | 0.141 kg | 0.038 kg |
| 2001 | 0.169 kg | 0.038 kg |
| 2000 | 0.134 kg | 0.038 kg |
| 1999 | 0.144 kg | 0.044 kg |
| 1998 | 0.157 kg | 0.046 kg |
| 1997 | 0.157 kg | 0.045 kg |
| 1996 | 0.158 kg | 0.043 kg |
| 1995 | 0.149 kg | 0.038 kg |
| 1994 | 0.143 kg | 0.041 kg |
| 1993 | 0.126 kg | 0.025 kg |
| 1992 | 0.107 kg | 0.023 kg |
| 1991 | 0.105 kg | 0.023 kg |
| 1990 | 0.125 kg | 0.038 kg |
Carbon intensity is 0.117 kg of CO2 per dollar of GDP in Namibia and 0.035 kg in the DR Congo: 0.082 kg more in Namibia. In 1990, Namibia emitted 0.125 kg and the DR Congo 0.038 kg, a difference of 0.087 kg.
Namibia's carbon intensity has been higher than the DR Congo's every year since 1990. The gap was widest in 2001, when Namibia's carbon intensity was 0.131 kg above the DR Congo's.
Namibia vs DR Congo: latest carbon intensity of GDP
Compare the carbon intensity of GDP of any 2 countries
Sources:
- World Bank | Environment (1990–2024, updated October 2026)
Creative Commons Attribution (CC BY): you may copy, share, adapt and reuse this content, also commercially, as long as you credit statistics.wiki and note any changes you made. The sources listed above may have their own license terms.