
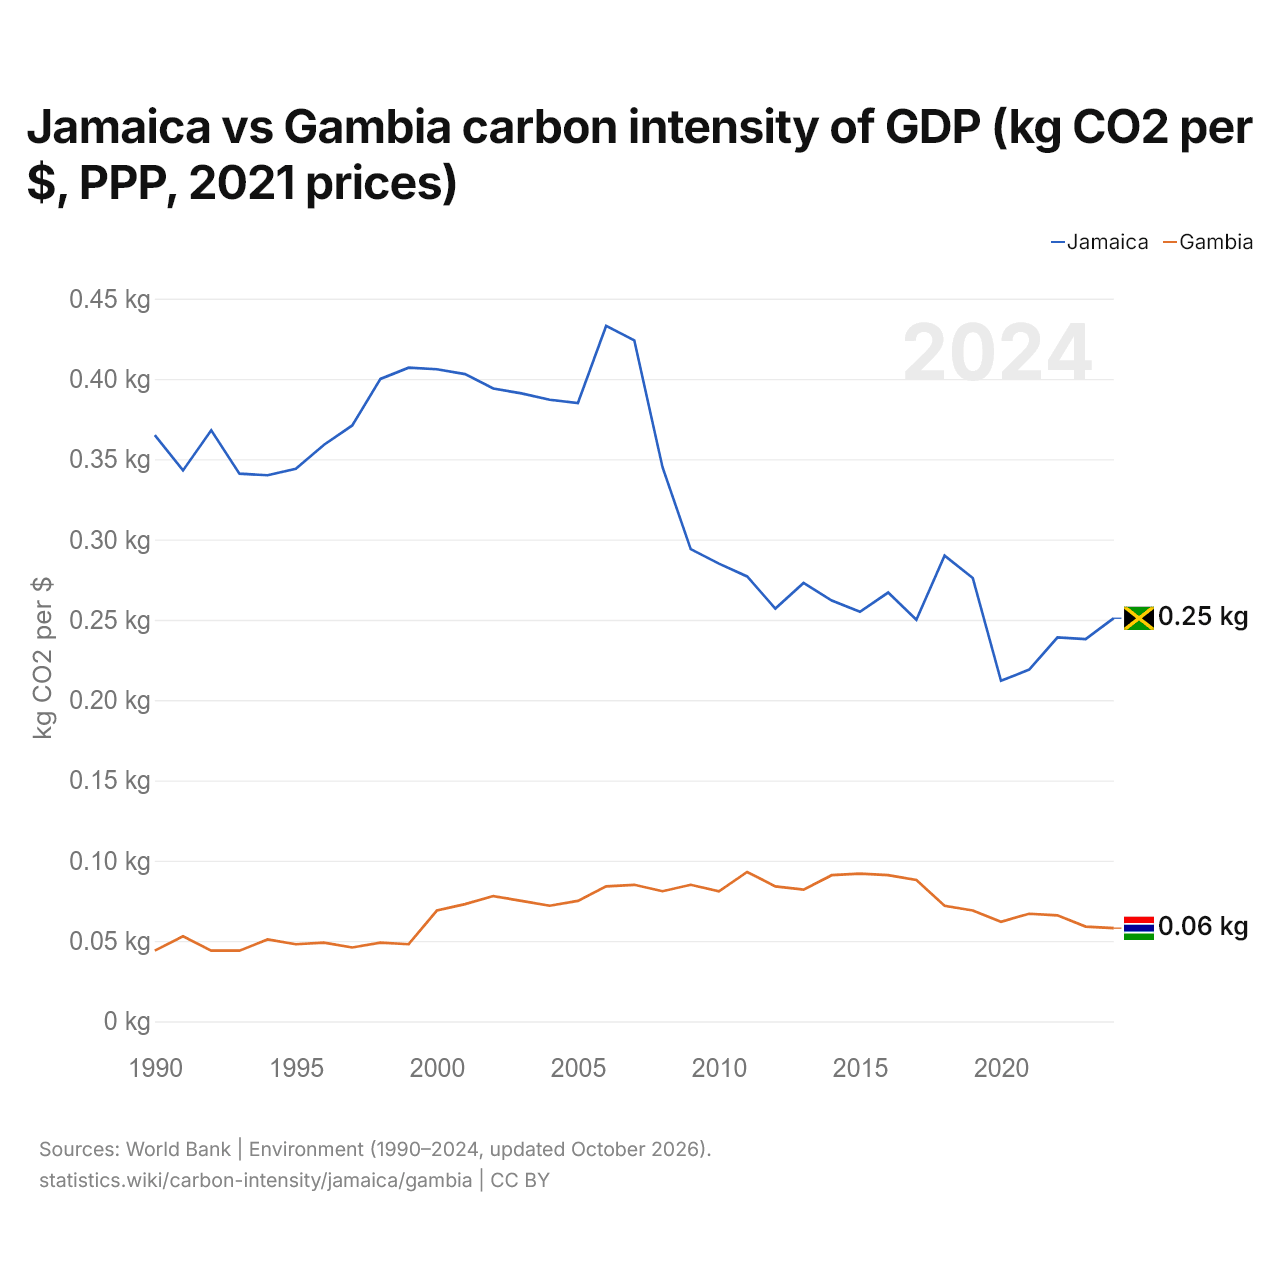
Jamaica vs Gambia carbon intensity of GDP (kg CO2 per $, PPP, 2021 prices)
1x
| Year | kg CO2 per $ | |
|---|---|---|
 Jamaica |
 Gambia |
|
| 2024 | 0.251 kg | 0.058 kg |
| 2023 | 0.238 kg | 0.059 kg |
| 2022 | 0.239 kg | 0.066 kg |
| 2021 | 0.219 kg | 0.067 kg |
| 2020 | 0.212 kg | 0.062 kg |
| 2019 | 0.276 kg | 0.069 kg |
| 2018 | 0.29 kg | 0.072 kg |
| 2017 | 0.25 kg | 0.088 kg |
| 2016 | 0.267 kg | 0.091 kg |
| 2015 | 0.255 kg | 0.092 kg |
| 2014 | 0.262 kg | 0.091 kg |
| 2013 | 0.273 kg | 0.082 kg |
| 2012 | 0.257 kg | 0.084 kg |
| 2011 | 0.277 kg | 0.093 kg |
| 2010 | 0.285 kg | 0.081 kg |
| 2009 | 0.294 kg | 0.085 kg |
| 2008 | 0.345 kg | 0.081 kg |
| 2007 | 0.424 kg | 0.085 kg |
| 2006 | 0.433 kg | 0.084 kg |
| 2005 | 0.385 kg | 0.075 kg |
| 2004 | 0.387 kg | 0.072 kg |
| 2003 | 0.391 kg | 0.075 kg |
| 2002 | 0.394 kg | 0.078 kg |
| 2001 | 0.403 kg | 0.073 kg |
| 2000 | 0.406 kg | 0.069 kg |
| 1999 | 0.407 kg | 0.048 kg |
| 1998 | 0.4 kg | 0.049 kg |
| 1997 | 0.371 kg | 0.046 kg |
| 1996 | 0.359 kg | 0.049 kg |
| 1995 | 0.344 kg | 0.048 kg |
| 1994 | 0.34 kg | 0.051 kg |
| 1993 | 0.341 kg | 0.044 kg |
| 1992 | 0.368 kg | 0.044 kg |
| 1991 | 0.343 kg | 0.053 kg |
| 1990 | 0.365 kg | 0.044 kg |
Carbon intensity is 0.251 kg of CO2 per dollar of GDP in Jamaica and 0.058 kg in the Gambia: 0.193 kg more in Jamaica. In 1990, Jamaica emitted 0.365 kg and the Gambia 0.044 kg, a difference of 0.321 kg.
Jamaica's carbon intensity has been higher than the Gambia's every year since 1990. The gap was widest in 1999, when Jamaica's carbon intensity was 0.359 kg above the Gambia's.
Jamaica vs Gambia: latest carbon intensity of GDP
Compare the carbon intensity of GDP of any 2 countries
Sources:
- World Bank | Environment (1990–2024, updated October 2026)
Creative Commons Attribution (CC BY): you may copy, share, adapt and reuse this content, also commercially, as long as you credit statistics.wiki and note any changes you made. The sources listed above may have their own license terms.