
Grenada vs Bahamas carbon intensity of GDP (kg CO2 per $, PPP, 2021 prices)
1x
| Year | kg CO2 per $ | |
|---|---|---|
 Grenada |
 Bahamas |
|
| 2024 | 0.086 kg | 0.1 kg |
| 2023 | 0.085 kg | 0.1 kg |
| 2022 | 0.088 kg | 0.103 kg |
| 2021 | 0.09 kg | 0.118 kg |
| 2020 | 0.09 kg | 0.112 kg |
| 2019 | 0.091 kg | 0.111 kg |
| 2018 | 0.073 kg | 0.092 kg |
| 2017 | 0.068 kg | 0.106 kg |
| 2016 | 0.071 kg | 0.1 kg |
| 2015 | 0.067 kg | 0.089 kg |
| 2014 | 0.067 kg | 0.091 kg |
| 2013 | 0.081 kg | 0.089 kg |
| 2012 | 0.064 kg | 0.08 kg |
| 2011 | 0.061 kg | 0.071 kg |
| 2010 | 0.08 kg | 0.107 kg |
| 2009 | 0.071 kg | 0.096 kg |
| 2008 | 0.062 kg | 0.11 kg |
| 2007 | 0.057 kg | 0.104 kg |
| 2006 | 0.054 kg | 0.088 kg |
| 2005 | 0.046 kg | 0.071 kg |
| 2004 | 0.048 kg | 0.074 kg |
| 2003 | 0.05 kg | 0.069 kg |
| 2002 | 0.05 kg | 0.092 kg |
| 2001 | 0.048 kg | 0.086 kg |
| 2000 | 0.046 kg | 0.089 kg |
| 1999 | 0.067 kg | 0.121 kg |
| 1998 | 0.071 kg | 0.144 kg |
| 1997 | 0.091 kg | 0.131 kg |
| 1996 | 0.07 kg | 0.132 kg |
| 1995 | 0.069 kg | 0.123 kg |
| 1994 | 0.078 kg | 0.111 kg |
| 1993 | 0.068 kg | 0.103 kg |
| 1992 | 0.059 kg | 0.101 kg |
| 1991 | 0.057 kg | 0.112 kg |
| 1990 | 0.057 kg | 0.119 kg |
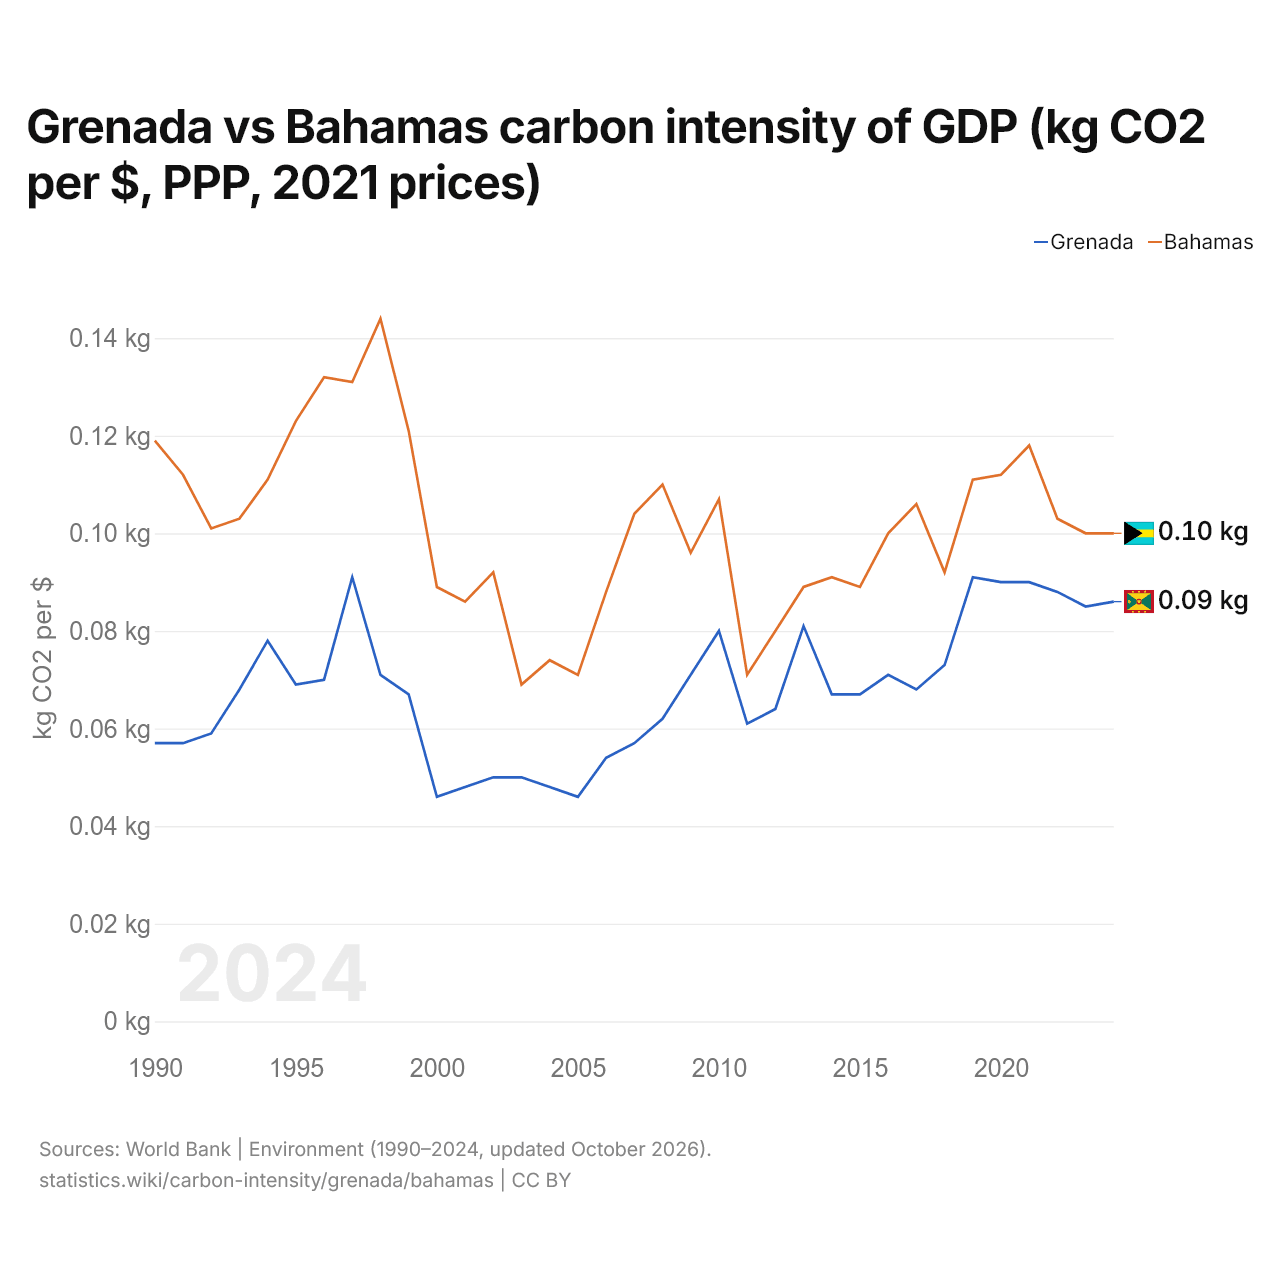
Carbon intensity is 0.086 kg of CO2 per dollar of GDP in Grenada and 0.100 kg in the Bahamas: 0.014 kg more in the Bahamas. In 1990, Grenada emitted 0.057 kg and the Bahamas 0.119 kg, a difference of 0.062 kg.
The Bahamas' carbon intensity has been higher than Grenada's every year since 1990. The gap was widest in 1998, when the Bahamas' carbon intensity was 0.073 kg above Grenada's.
Grenada vs Bahamas: latest carbon intensity of GDP
Compare the carbon intensity of GDP of any 2 countries
Sources:
- World Bank | Environment (1990–2024, updated October 2026)
Creative Commons Attribution (CC BY): you may copy, share, adapt and reuse this content, also commercially, as long as you credit statistics.wiki and note any changes you made. The sources listed above may have their own license terms.