
Mianmar vs Brasil: gastos militares (US$), 1960–2025
| Ano | US$ | |
|---|---|---|
 Mianmar |
 Brasil |
|
| 2025 | - | US$ 24.041.602.560 |
| 2024 | US$ 4.892.070.141 | US$ 20.963.640.494 |
| 2023 | US$ 2.491.760.732 | US$ 21.788.291.369 |
| 2022 | US$ 2.379.216.057 | US$ 20.542.063.933 |
| 2021 | US$ 2.925.235.849 | US$ 19.196.367.283 |
| 2020 | US$ 2.591.264.028 | US$ 19.582.928.160 |
| 2019 | US$ 1.537.117.729 | US$ 25.903.777.717 |
| 2018 | US$ 1.482.152.242 | US$ 28.172.750.473 |
| 2017 | US$ 2.221.653.980 | US$ 29.178.548.902 |
| 2016 | US$ 2.410.634.735 | US$ 24.205.506.642 |
| 2015 | US$ 2.432.545.489 | US$ 24.609.516.836 |
| 2014 | US$ 2.345.387.655 | US$ 32.671.384.712 |
| 2013 | US$ 2.343.092.533 | US$ 32.874.802.475 |
| 2012 | US$ 2.334.982.191 | US$ 33.987.022.473 |
| 2011 | - | US$ 36.936.231.974 |
| 2010 | - | US$ 34.003.002.454 |
| 2009 | - | US$ 25.648.835.222 |
| 2008 | - | US$ 24.452.942.953 |
| 2007 | - | US$ 20.485.779.340 |
| 2006 | - | US$ 16.404.890.078 |
| 2005 | US$ 189.023.341 | US$ 13.588.619.758 |
| 2004 | US$ 191.629.643 | US$ 9.780.114.929 |
| 2003 | US$ 204.714.012 | US$ 8.392.919.520 |
| 2002 | US$ 94.856.710 | US$ 9.664.551.976 |
| 2001 | US$ 119.169.146 | US$ 10.930.222.264 |
| 2000 | US$ 194.155.098 | US$ 11.344.013.932 |
| 1999 | US$ 171.445.390 | US$ 9.866.957.600 |
| 1998 | US$ 154.933.456 | US$ 14.357.394.162 |
| 1997 | US$ 109.260.646 | US$ 13.934.240.699 |
| 1996 | US$ 213.922.037 | US$ 14.073.226.544 |
| 1995 | US$ 194.897.231 | US$ 14.326.035.244 |
| 1994 | US$ 156.951.595 | US$ 10.591.489.382 |
| 1993 | US$ 111.436.630 | US$ 7.100.386.157 |
| 1992 | US$ 80.895.954 | US$ 4.993.534.629 |
| 1991 | US$ 65.634.490 | US$ 6.725.085.985 |
| 1990 | US$ 71.829.656 | US$ 9.099.838.113 |
| 1989 | US$ 59.580.082 | US$ 11.093.965.910 |
| 1988 | US$ 32.992.424 | US$ 6.521.161.599 |
| 1987 | US$ 30.817.741 | US$ 4.936.494.341 |
| 1986 | US$ 45.573.185 | US$ 3.130.063.412 |
| 1985 | US$ 44.045.784 | US$ 3.014.576.139 |
| 1984 | US$ 38.126.520 | US$ 2.259.215.294 |
| 1983 | US$ 42.419.409 | US$ 2.379.393.210 |
| 1982 | US$ 47.667.766 | US$ 3.536.672.699 |
| 1981 | US$ 38.405.301 | US$ 2.949.497.292 |
| 1980 | US$ 35.529.410 | US$ 2.702.569.201 |
| 1979 | US$ 33.877.598 | US$ 3.368.616.267 |
| 1978 | US$ 36.680.967 | US$ 3.203.800.523 |
| 1977 | US$ 35.290.647 | US$ 2.976.206.092 |
| 1976 | US$ 45.702.782 | US$ 3.067.596.285 |
| 1975 | US$ 40.056.498 | US$ 2.548.079.899 |
| 1974 | US$ 49.282.041 | US$ 2.131.499.654 |
| 1973 | US$ 36.807.861 | US$ 1.801.122.064 |
| 1972 | US$ 36.101.476 | US$ 1.423.363.287 |
| 1971 | US$ 33.198.033 | US$ 1.279.923.771 |
| 1970 | US$ 31.570.076 | US$ 1.222.122.245 |
| 1969 | US$ 30.367.911 | US$ 972.257.722 |
| 1968 | US$ 28.127.701 | US$ 899.068.956 |
| 1967 | US$ 21.866.230 | US$ 888.129.438 |
| 1966 | US$ 17.954.286 | US$ 854.716.848 |
| 1965 | US$ 24.576.485 | US$ 753.065.031 |
| 1964 | US$ 24.777.129 | US$ 422.314.015 |
| 1963 | US$ 41.014.264 | US$ 526.497.737 |
| 1962 | US$ 36.109.207 | US$ 461.308.725 |
| 1961 | US$ 37.082.549 | US$ 408.414.668 |
| 1960 | - | US$ 456.269.116 |
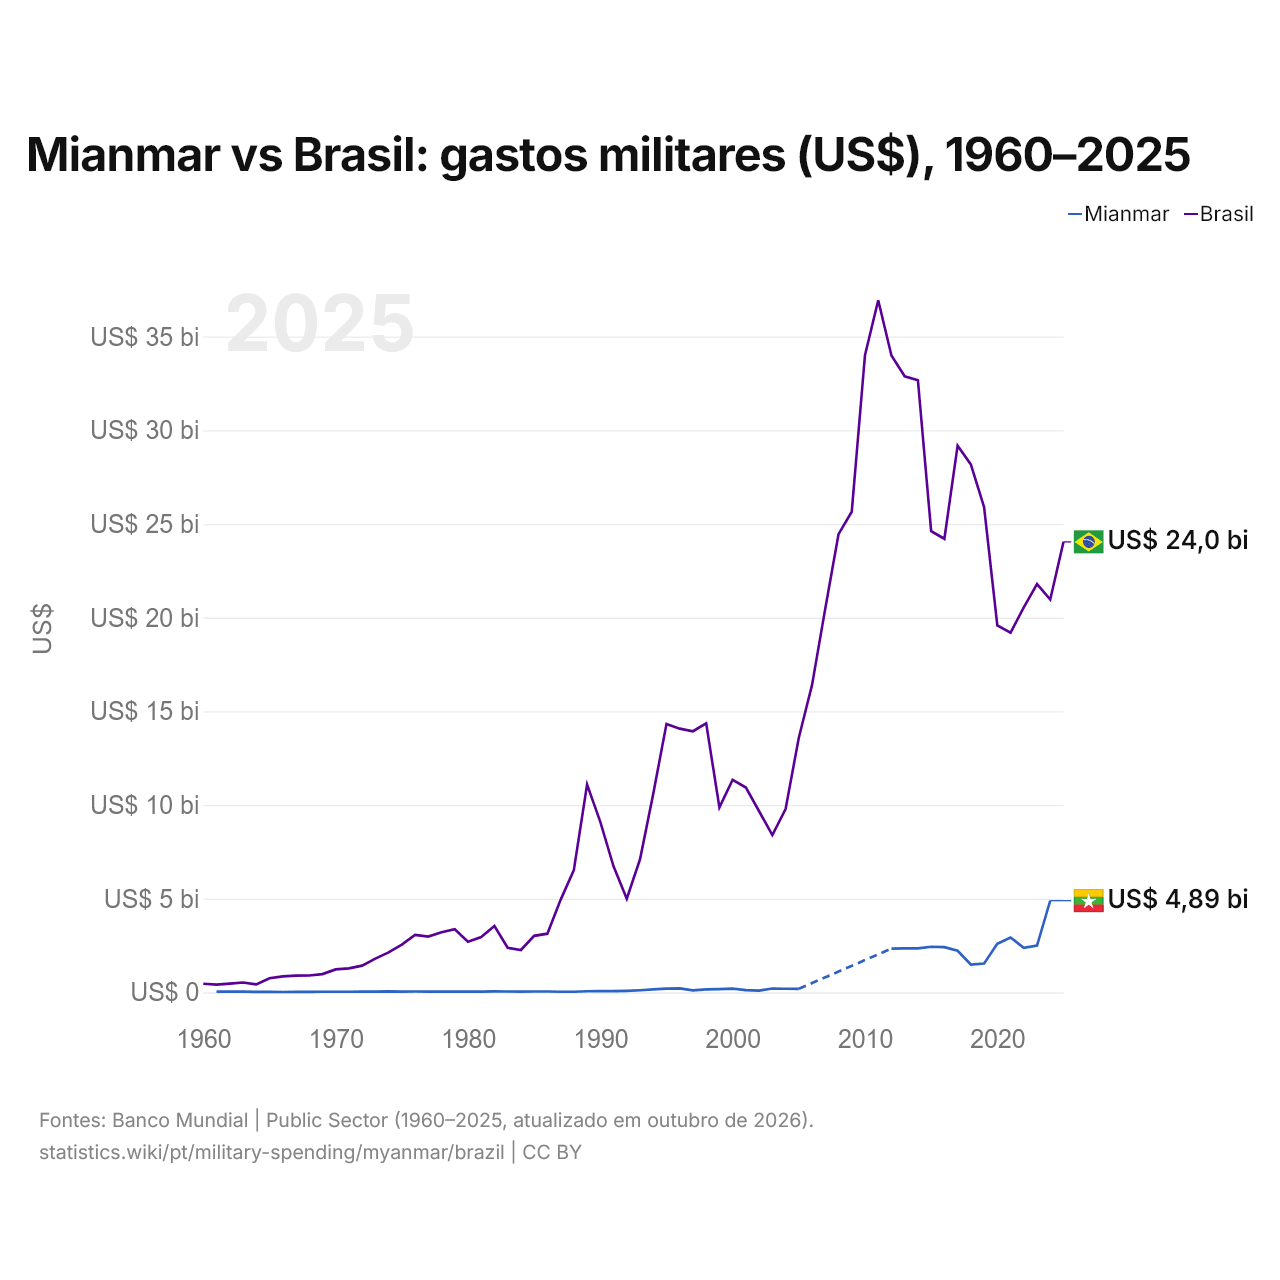
Os gastos militares foram de US$ 4,89 bilhões em Mianmar (2024) e de US$ 21 bilhões no Brasil (2024): 4,3 vezes mais no Brasil. Em 1961, foram de US$ 37,1 milhões em Mianmar e de US$ 408 milhões no Brasil, 11 vezes mais no Brasil.
Mianmar vs Brasil: gastos militares em % do PIB, 1960–2025
| Ano | % do PIB | |
|---|---|---|
|
Mianmar
|
Brasil
|
|
| 2025 | - | 1,1% |
| 2024 | 6,6% | 1% |
| 2023 | 3,7% | 1% |
| 2022 | 3,8% | 1,1% |
| 2021 | 4,4% | 1,1% |
| 2020 | 3,3% | 1,3% |
| 2019 | 2% | 1,4% |
| 2018 | 2,2% | 1,5% |
| 2017 | 3,4% | 1,4% |
| 2016 | 3,8% | 1,3% |
| 2015 | 4,1% | 1,4% |
| 2014 | 3,6% | 1,3% |
| 2013 | 3,9% | 1,3% |
| 2012 | 3,9% | 1,4% |
| 2011 | - | 1,4% |
| 2010 | - | 1,5% |
| 2009 | - | 1,5% |
| 2008 | - | 1,4% |
| 2007 | - | 1,5% |
| 2006 | - | 1,5% |
| 2005 | 1,6% | 1,5% |
| 2004 | 1,8% | 1,5% |
| 2003 | 2% | 1,5% |
| 2002 | 1,4% | 1,9% |
| 2001 | 1,8% | 2% |
| 2000 | 2,2% | 1,7% |
| 1999 | 2% | 1,6% |
| 1998 | 2,4% | 1,7% |
| 1997 | 2,3% | 1,6% |
| 1996 | 3,5% | 1,7% |
| 1995 | 3,7% | 1,9% |
| 1994 | 3,5% | 2% |
| 1993 | 3,5% | 1,9% |
| 1992 | 3,4% | 1,5% |
| 1991 | 3,2% | 2% |
| 1990 | 3,4% | 2,4% |
| 1989 | 3% | 2,7% |
| 1988 | 2,1% | 2,1% |
| 1987 | 2% | 1,7% |
| 1986 | 2,9% | 1,2% |
| 1985 | 3% | 1,4% |
| 1984 | 2,9% | 1,2% |
| 1983 | 3,1% | 1,3% |
| 1982 | 3,2% | 1,3% |
| 1981 | 3,5% | 1,1% |
| 1980 | 3,4% | 1,1% |
| 1979 | 3,6% | 1,5% |
| 1978 | 3,9% | 1,6% |
| 1977 | 4% | 1,7% |
| 1976 | 3,8% | 2% |
| 1975 | 3,8% | 2% |
| 1974 | 4% | 1,9% |
| 1973 | 5,1% | 2,2% |
| 1972 | 5,5% | 2,4% |
| 1971 | 5,7% | 2,6% |
| 1970 | 5,6% | 2,9% |
| 1969 | 5,3% | 2,6% |
| 1968 | 5% | 2,6% |
| 1967 | 5,2% | 2,9% |
| 1966 | 6,1% | 3% |
| 1965 | 6,7% | 3,4% |
| 1964 | 6% | 2% |
| 1963 | 6,8% | 2,3% |
| 1962 | 5,7% | 2,4% |
| 1961 | 6,1% | 2,4% |
| 1960 | - | 2,7% |
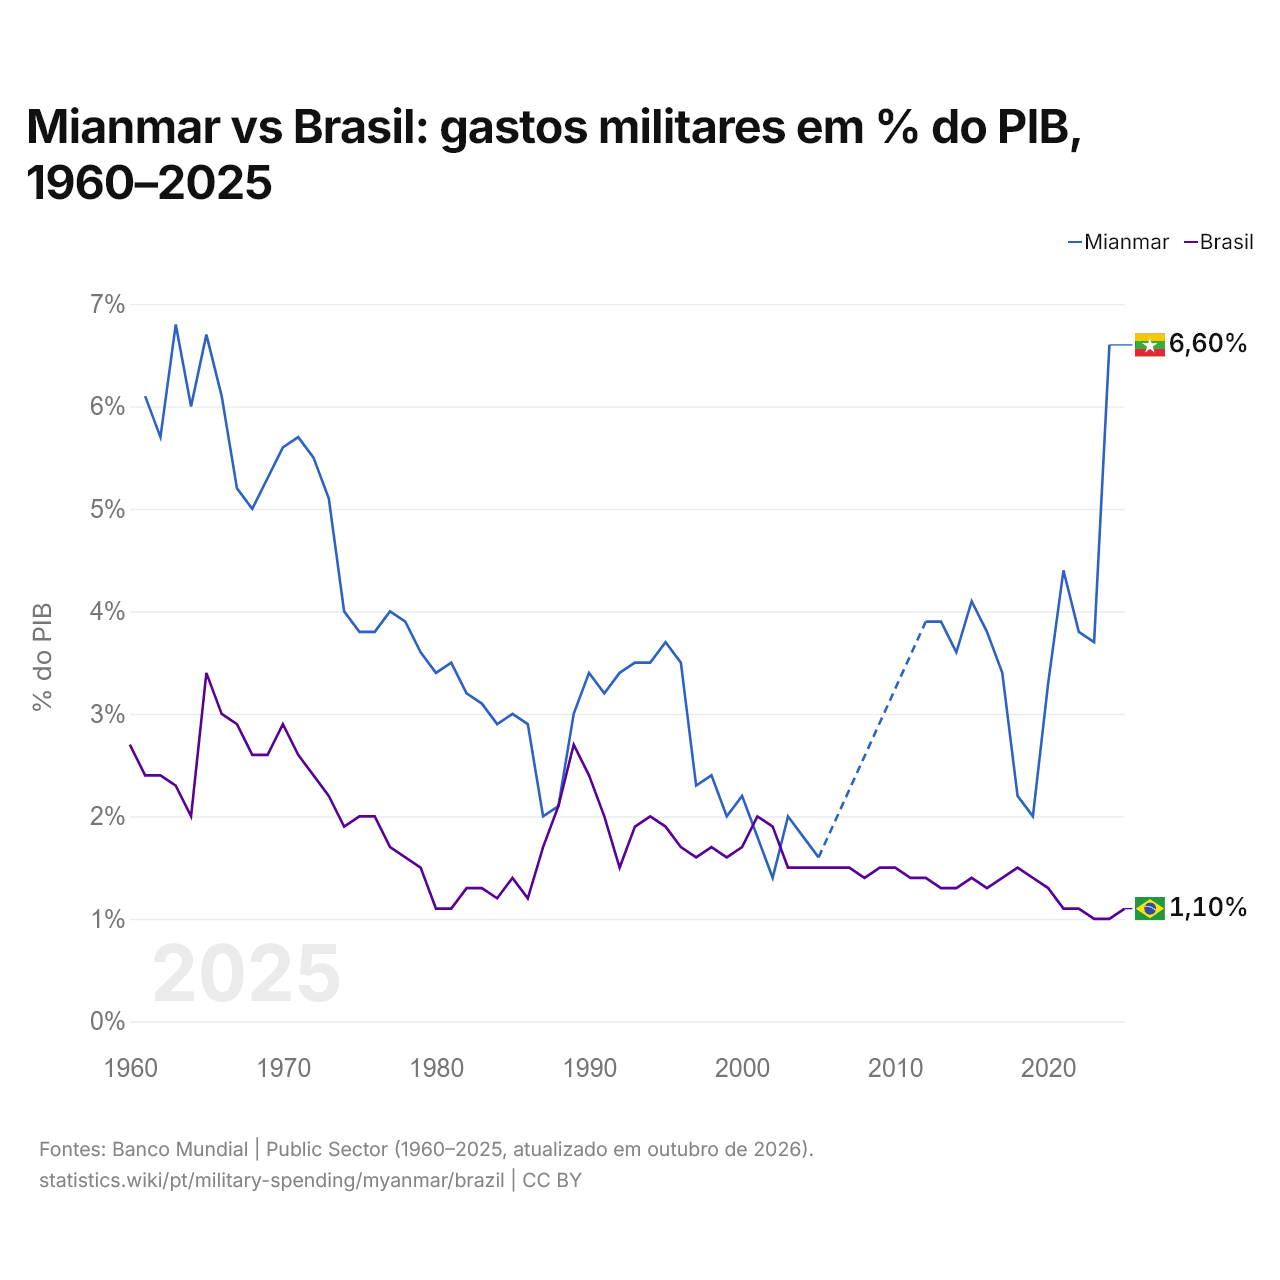
Os gastos militares foram de 6,6% do PIB em Mianmar (2024) e de 1,0% no Brasil (2024): 5,6 pontos percentuais a mais em Mianmar. Em 2014, foram de 3,6% em Mianmar e de 1,3% no Brasil, 2,3 pontos percentuais a mais em Mianmar.
Os gastos militares de Mianmar, como proporção do PIB, têm sido mais altos que os do Brasil em todos os anos desde 2003 em que os dois países os informaram.
Mianmar vs Brasil: dados dos gastos militares
|
Mianmar
|
Brasil
|
|
|---|---|---|
| US$ | US$ 4,89 bi (2024) | US$ 24,0 bi (2025) |
| % do PIB | 6,6% (2024) | 1,1% (2025) |
| Por pessoa, US$ | US$ 89,8 (2024) | US$ 113 (2025) |
| Participação mundial | 0,18% (2024) | 0,84% (2025) |
| Posição mundial | 50/154 | 21/154 |
Comparar os gastos militares de 2 países quaisquer
Fontes:
- Banco Mundial | Public Sector (1960–2025, atualizado em outubro de 2026)
Creative Commons Atribuição (CC BY): você pode copiar, compartilhar, adaptar e reutilizar este conteúdo, inclusive para fins comerciais, desde que cite o statistics.wiki e indique as alterações que fizer. As fontes listadas acima podem ter suas próprias condições de licença.