
Mianmar vs Índia: gastos militares (US$), 1960–2025
| Ano | US$ | |
|---|---|---|
 Mianmar |
 Índia |
|
| 2025 | - | US$ 90.798.828.764 |
| 2024 | US$ 4.892.070.141 | US$ 83.617.044.488 |
| 2023 | US$ 2.491.760.732 | US$ 82.509.152.616 |
| 2022 | US$ 2.379.216.057 | US$ 77.449.222.402 |
| 2021 | US$ 2.925.235.849 | US$ 78.191.725.253 |
| 2020 | US$ 2.591.264.028 | US$ 74.992.561.781 |
| 2019 | US$ 1.537.117.729 | US$ 72.194.485.141 |
| 2018 | US$ 1.482.152.242 | US$ 65.526.705.051 |
| 2017 | US$ 2.221.653.980 | US$ 67.122.372.185 |
| 2016 | US$ 2.410.634.735 | US$ 58.360.161.904 |
| 2015 | US$ 2.432.545.489 | US$ 51.694.633.429 |
| 2014 | US$ 2.345.387.655 | US$ 51.875.005.787 |
| 2013 | US$ 2.343.092.533 | US$ 47.324.579.926 |
| 2012 | US$ 2.334.982.191 | US$ 47.850.592.348 |
| 2011 | - | US$ 49.304.112.652 |
| 2010 | - | US$ 48.416.295.009 |
| 2009 | - | US$ 41.992.838.663 |
| 2008 | - | US$ 31.548.455.391 |
| 2007 | - | US$ 30.153.728.550 |
| 2006 | - | US$ 25.202.552.677 |
| 2005 | US$ 189.023.341 | US$ 23.877.987.286 |
| 2004 | US$ 191.629.643 | US$ 20.060.173.759 |
| 2003 | US$ 204.714.012 | US$ 16.272.868.820 |
| 2002 | US$ 94.856.710 | US$ 14.556.643.755 |
| 2001 | US$ 119.169.146 | US$ 14.196.383.987 |
| 2000 | US$ 194.155.098 | US$ 13.812.655.617 |
| 1999 | US$ 171.445.390 | US$ 13.568.236.197 |
| 1998 | US$ 154.933.456 | US$ 11.491.562.580 |
| 1997 | US$ 109.260.646 | US$ 11.011.060.330 |
| 1996 | US$ 213.922.037 | US$ 9.715.428.866 |
| 1995 | US$ 194.897.231 | US$ 9.289.809.855 |
| 1994 | US$ 156.951.595 | US$ 8.720.806.769 |
| 1993 | US$ 111.436.630 | US$ 7.886.030.639 |
| 1992 | US$ 80.895.954 | US$ 7.795.566.320 |
| 1991 | US$ 65.634.490 | US$ 7.859.996.106 |
| 1990 | US$ 71.829.656 | US$ 10.098.689.025 |
| 1989 | US$ 59.580.082 | US$ 10.462.658.221 |
| 1988 | US$ 32.992.424 | US$ 11.058.855.369 |
| 1987 | US$ 30.817.741 | US$ 11.806.796.950 |
| 1986 | US$ 45.573.185 | US$ 10.224.531.865 |
| 1985 | US$ 44.045.784 | US$ 8.298.407.791 |
| 1984 | US$ 38.126.520 | US$ 7.249.162.800 |
| 1983 | US$ 42.419.409 | US$ 7.253.000.983 |
| 1982 | US$ 47.667.766 | US$ 6.714.173.824 |
| 1981 | US$ 38.405.301 | US$ 6.165.115.094 |
| 1980 | US$ 35.529.410 | US$ 5.839.130.230 |
| 1979 | US$ 33.877.598 | US$ 4.989.684.211 |
| 1978 | US$ 36.680.967 | US$ 4.292.525.952 |
| 1977 | US$ 35.290.647 | US$ 3.842.345.403 |
| 1976 | US$ 45.702.782 | US$ 3.572.358.168 |
| 1975 | US$ 40.056.498 | US$ 3.480.654.866 |
| 1974 | US$ 49.282.041 | US$ 3.187.664.078 |
| 1973 | US$ 36.807.861 | US$ 2.701.198.653 |
| 1972 | US$ 36.101.476 | US$ 2.657.020.024 |
| 1971 | US$ 33.198.033 | US$ 2.459.978.741 |
| 1970 | US$ 31.570.076 | US$ 1.988.270.343 |
| 1969 | US$ 30.367.911 | US$ 1.835.743.136 |
| 1968 | US$ 28.127.701 | US$ 1.722.924.879 |
| 1967 | US$ 21.866.230 | US$ 1.616.312.294 |
| 1966 | US$ 17.954.286 | US$ 1.628.330.499 |
| 1965 | US$ 24.576.485 | US$ 2.305.663.940 |
| 1964 | US$ 24.777.129 | US$ 2.157.116.120 |
| 1963 | US$ 41.014.264 | US$ 1.949.130.603 |
| 1962 | US$ 36.109.207 | US$ 1.157.501.505 |
| 1961 | US$ 37.082.549 | US$ 813.821.845 |
| 1960 | - | US$ 742.083.444 |
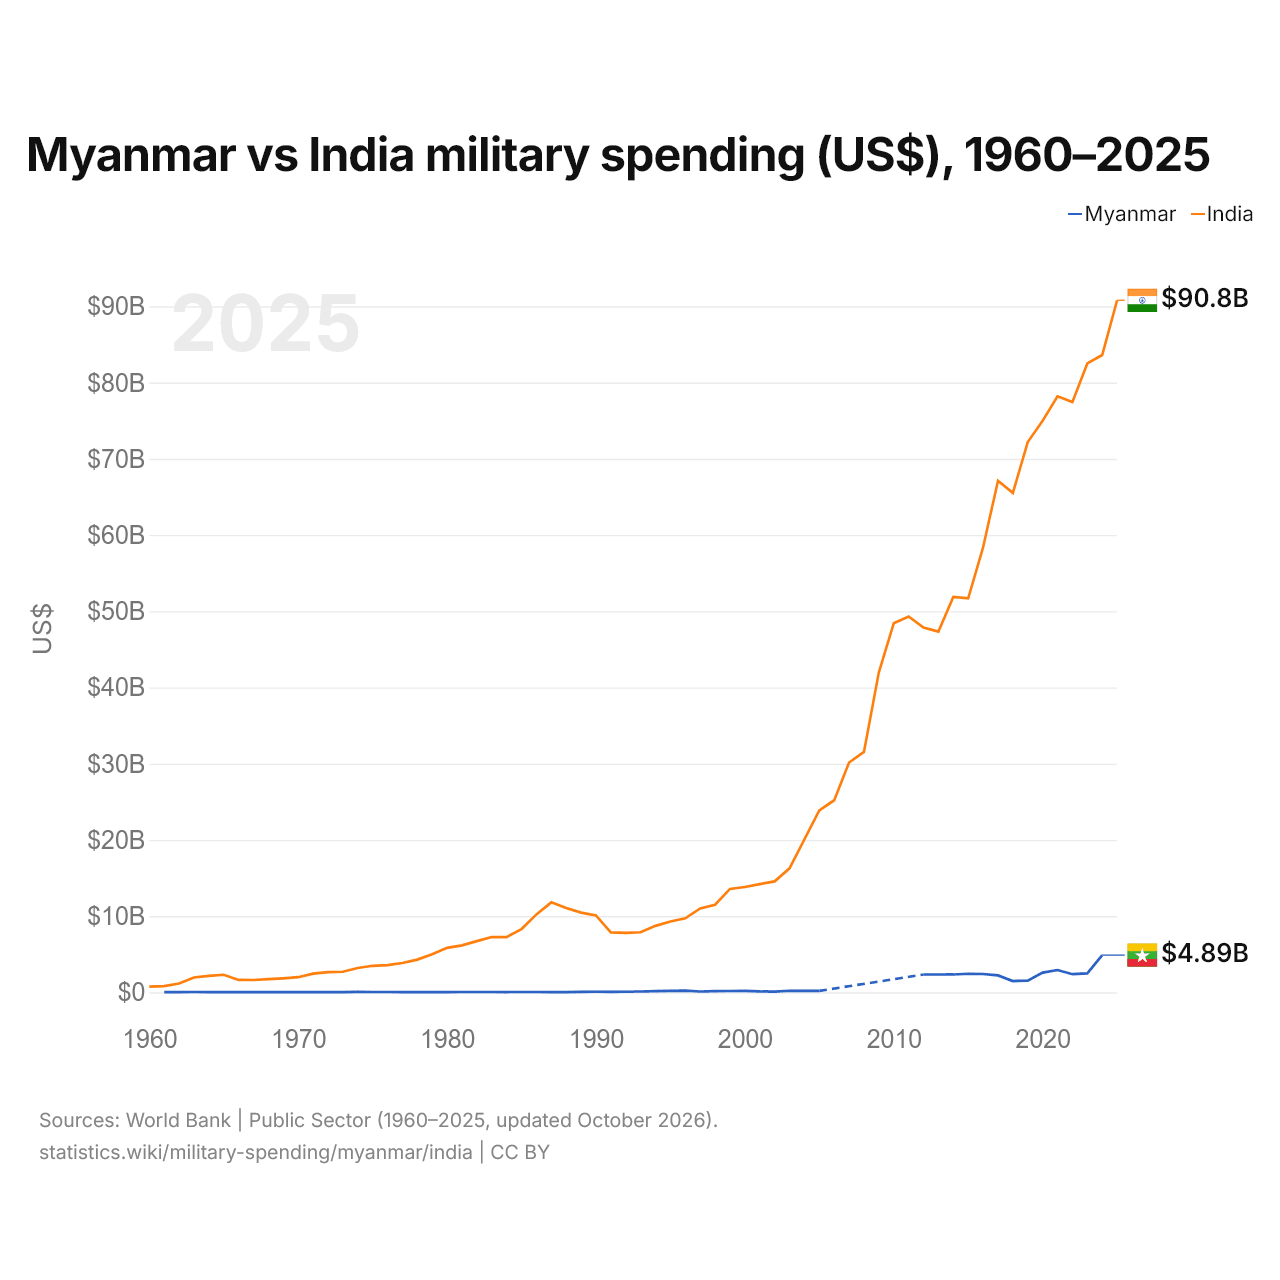
Os gastos militares foram de US$ 4,89 bilhões em Mianmar (2024) e de US$ 83,6 bilhões na Índia (2024): 17 vezes mais na Índia. Em 1961, foram de US$ 37,1 milhões em Mianmar e de US$ 814 milhões na Índia, 22 vezes mais na Índia.
Mianmar vs Índia: gastos militares em % do PIB, 1960–2025
| Ano | % do PIB | |
|---|---|---|
|
Mianmar
|
Índia
|
|
| 2025 | - | 2,3% |
| 2024 | 6,6% | 2,2% |
| 2023 | 3,7% | 2,4% |
| 2022 | 3,8% | 2,4% |
| 2021 | 4,4% | 2,5% |
| 2020 | 3,3% | 2,8% |
| 2019 | 2% | 2,5% |
| 2018 | 2,2% | 2,4% |
| 2017 | 3,4% | 2,5% |
| 2016 | 3,8% | 2,5% |
| 2015 | 4,1% | 2,5% |
| 2014 | 3,6% | 2,5% |
| 2013 | 3,9% | 2,5% |
| 2012 | 3,9% | 2,6% |
| 2011 | - | 2,7% |
| 2010 | - | 2,9% |
| 2009 | - | 3,1% |
| 2008 | - | 2,6% |
| 2007 | - | 2,5% |
| 2006 | - | 2,7% |
| 2005 | 1,6% | 2,9% |
| 2004 | 1,8% | 2,8% |
| 2003 | 2% | 2,7% |
| 2002 | 1,4% | 2,8% |
| 2001 | 1,8% | 2,9% |
| 2000 | 2,2% | 2,9% |
| 1999 | 2% | 3% |
| 1998 | 2,4% | 2,7% |
| 1997 | 2,3% | 2,6% |
| 1996 | 3,5% | 2,5% |
| 1995 | 3,7% | 2,6% |
| 1994 | 3,5% | 2,7% |
| 1993 | 3,5% | 2,8% |
| 1992 | 3,4% | 2,7% |
| 1991 | 3,2% | 2,9% |
| 1990 | 3,4% | 3,1% |
| 1989 | 3% | 3,5% |
| 1988 | 2,1% | 3,7% |
| 1987 | 2% | 4,2% |
| 1986 | 2,9% | 4,1% |
| 1985 | 3% | 3,6% |
| 1984 | 2,9% | 3,4% |
| 1983 | 3,1% | 3,3% |
| 1982 | 3,2% | 3,3% |
| 1981 | 3,5% | 3,2% |
| 1980 | 3,4% | 3,1% |
| 1979 | 3,6% | 3,3% |
| 1978 | 3,9% | 3,1% |
| 1977 | 4% | 3,2% |
| 1976 | 3,8% | 3,5% |
| 1975 | 3,8% | 3,5% |
| 1974 | 4% | 3,2% |
| 1973 | 5,1% | 3,2% |
| 1972 | 5,5% | 3,7% |
| 1971 | 5,7% | 3,7% |
| 1970 | 5,6% | 3,2% |
| 1969 | 5,3% | 3,1% |
| 1968 | 5% | 3,2% |
| 1967 | 5,2% | 3,2% |
| 1966 | 6,1% | 3,6% |
| 1965 | 6,7% | 3,9% |
| 1964 | 6% | 3,8% |
| 1963 | 6,8% | 4% |
| 1962 | 5,7% | 2,7% |
| 1961 | 6,1% | 2,1% |
| 1960 | - | 2% |
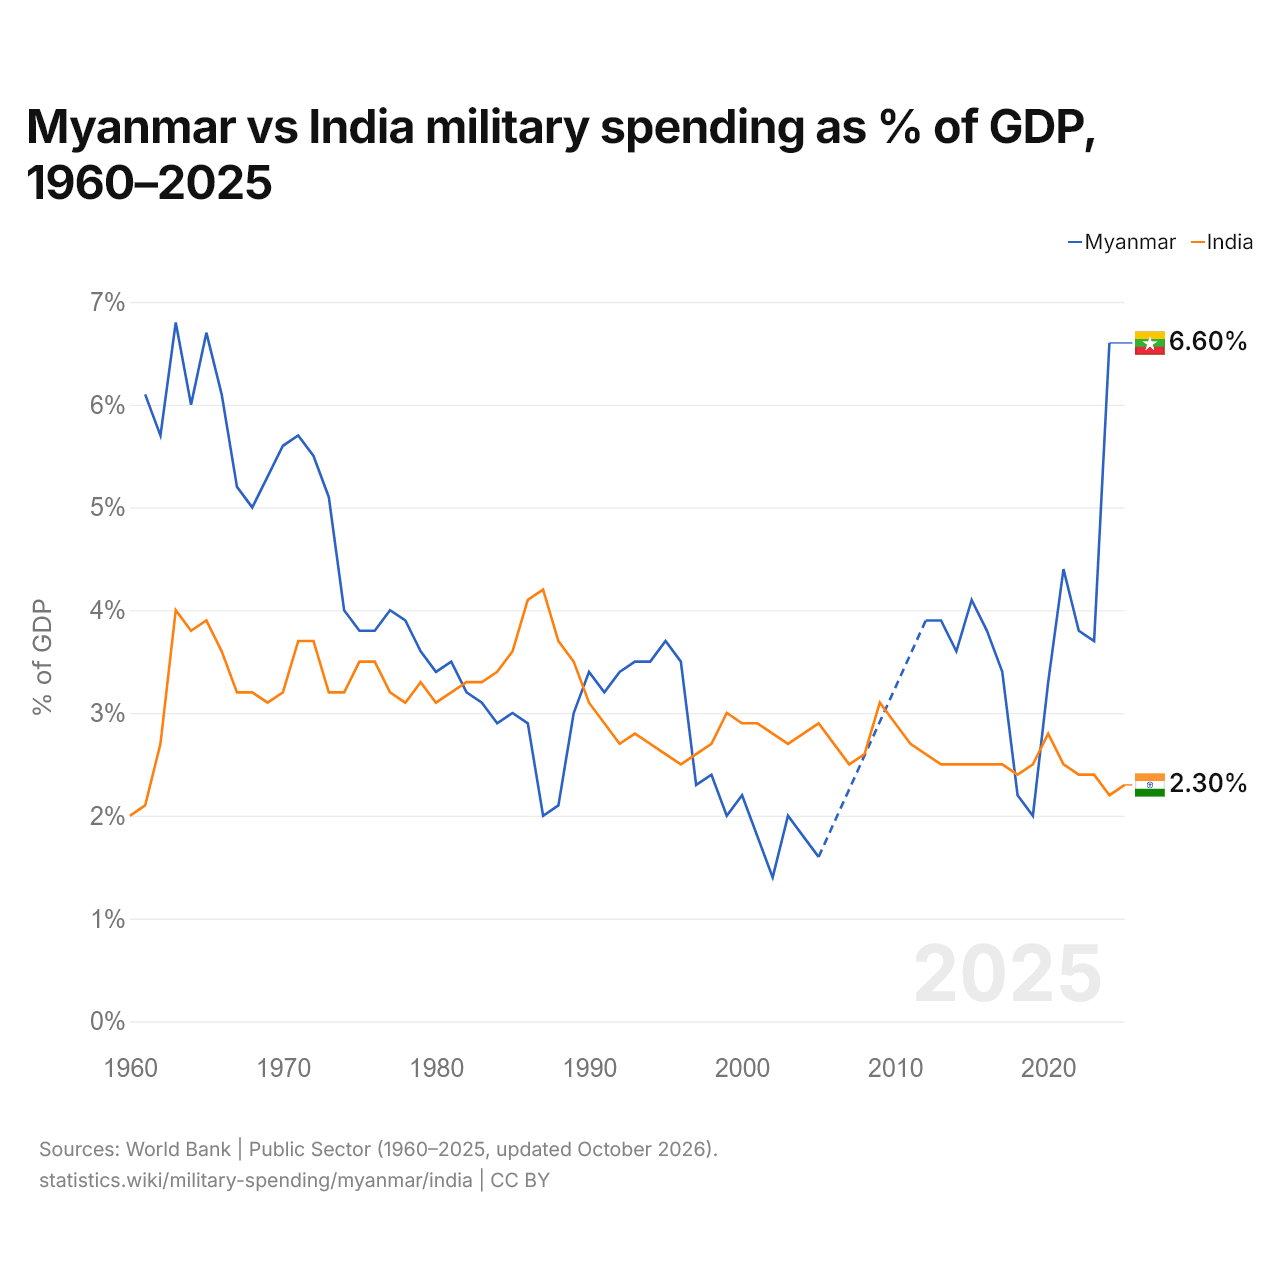
Os gastos militares foram de 6,6% do PIB em Mianmar (2024) e de 2,2% na Índia (2024): 4,4 pontos percentuais a mais em Mianmar. Em 2014, foram de 3,6% em Mianmar e de 2,5% na Índia, 1,1 pontos percentuais a mais em Mianmar.
Os gastos militares de Mianmar, como proporção do PIB, têm sido mais altos que os da Índia todos os anos desde 2020.
Mianmar vs Índia: dados dos gastos militares
|
Mianmar
|
Índia
|
|
|---|---|---|
| US$ | US$ 4,89 bi (2024) | US$ 90,8 bi (2025) |
| % do PIB | 6,6% (2024) | 2,3% (2025) |
| Por pessoa, US$ | US$ 89,8 (2024) | US$ 62 (2025) |
| Participação mundial | 0,18% (2024) | 3,18% (2025) |
| Posição mundial | 50/154 | 6/154 |
Comparar os gastos militares de 2 países quaisquer
Fontes:
- Banco Mundial | Public Sector (1960–2025, atualizado em outubro de 2026)
Creative Commons Atribuição (CC BY): você pode copiar, compartilhar, adaptar e reutilizar este conteúdo, inclusive para fins comerciais, desde que cite o statistics.wiki e indique as alterações que fizer. As fontes listadas acima podem ter suas próprias condições de licença.