
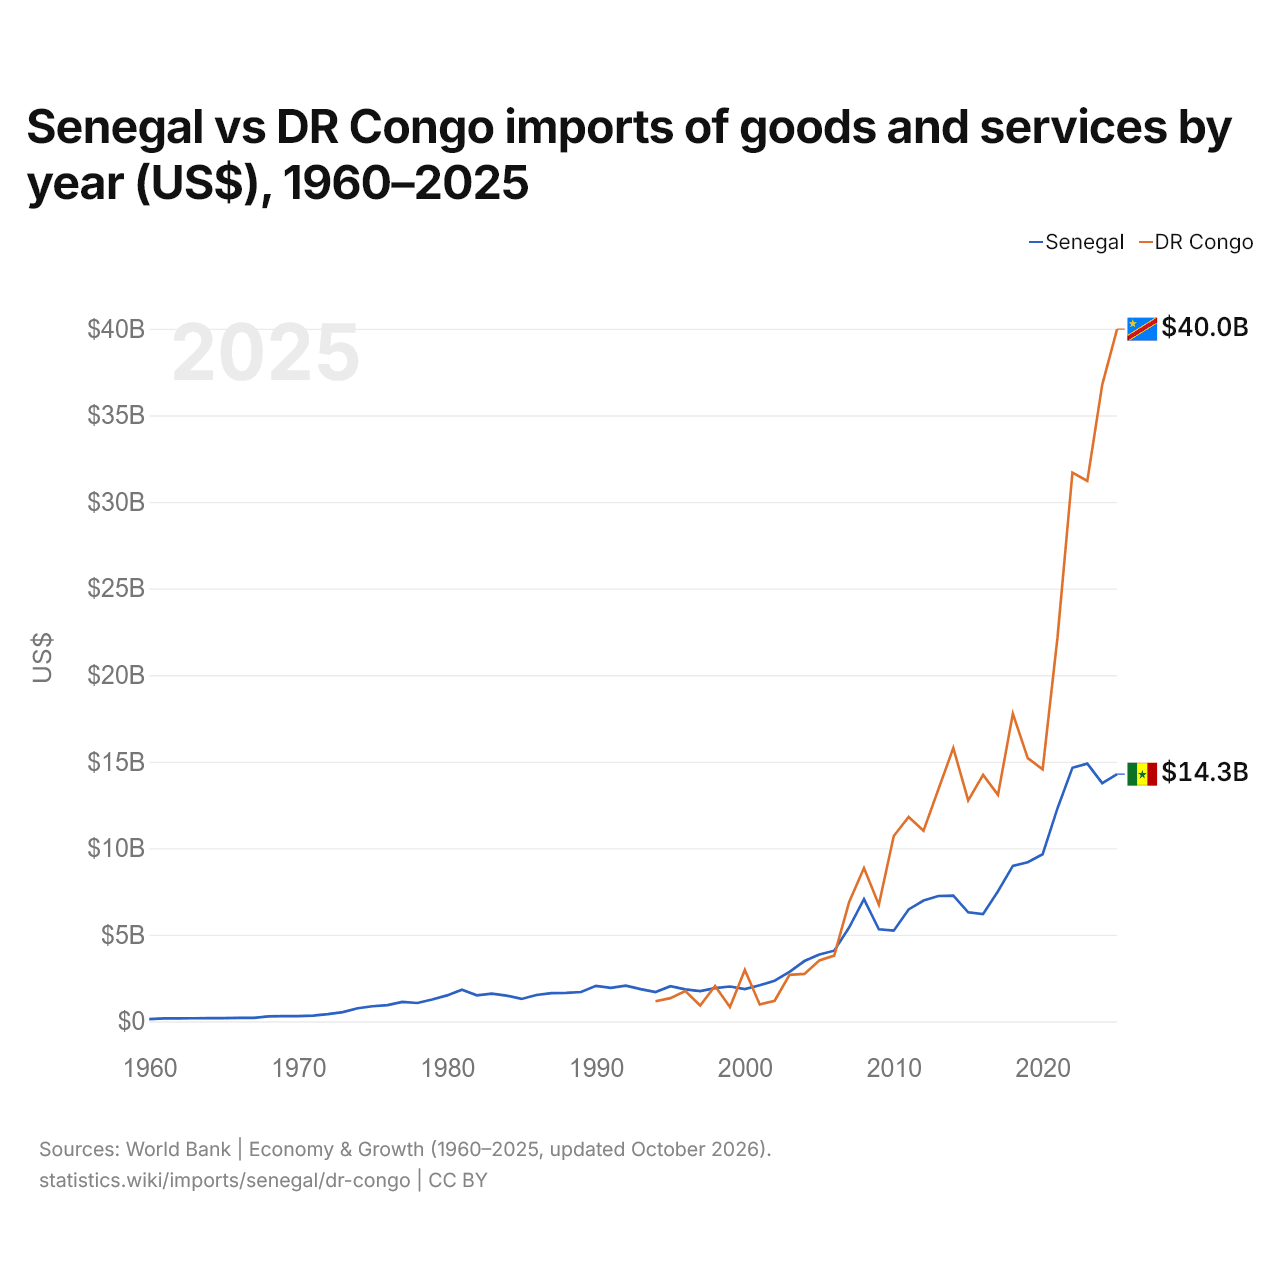
Senegal vs República Democrática do Congo: importações de bens e serviços por ano (US$), 1960–2025
| Ano | US$ | |
|---|---|---|
 Senegal |
 RDC |
|
| 2025 | US$ 14.277.431.783 | US$ 39.977.700.113 |
| 2024 | US$ 13.754.025.059 | US$ 36.761.361.427 |
| 2023 | US$ 14.883.981.467 | US$ 31.210.388.008 |
| 2022 | US$ 14.641.332.039 | US$ 31.691.354.758 |
| 2021 | US$ 12.311.805.835 | US$ 22.184.221.686 |
| 2020 | US$ 9.651.853.853 | US$ 14.559.943.991 |
| 2019 | US$ 9.186.797.791 | US$ 15.200.849.680 |
| 2018 | US$ 8.978.699.798 | US$ 17.774.432.829 |
| 2017 | US$ 7.516.719.955 | US$ 13.075.981.645 |
| 2016 | US$ 6.197.109.692 | US$ 14.238.061.710 |
| 2015 | US$ 6.298.158.532 | US$ 12.755.729.842 |
| 2014 | US$ 7.258.510.977 | US$ 15.788.562.505 |
| 2013 | US$ 7.241.502.995 | US$ 13.405.117.465 |
| 2012 | US$ 6.976.207.985 | US$ 11.004.072.620 |
| 2011 | US$ 6.461.833.841 | US$ 11.804.040.995 |
| 2010 | US$ 5.235.657.921 | US$ 10.704.450.756 |
| 2009 | US$ 5.314.157.879 | US$ 6.738.327.318 |
| 2008 | US$ 7.064.428.723 | US$ 8.854.254.132 |
| 2007 | US$ 5.418.129.806 | US$ 6.873.875.907 |
| 2006 | US$ 4.080.719.717 | US$ 3.795.633.937 |
| 2005 | US$ 3.863.797.090 | US$ 3.514.051.191 |
| 2004 | US$ 3.482.299.976 | US$ 2.739.841.247 |
| 2003 | US$ 2.858.883.233 | US$ 2.684.033.001 |
| 2002 | US$ 2.349.065.891 | US$ 1.190.984.744 |
| 2001 | US$ 2.083.798.870 | US$ 971.000.000 |
| 2000 | US$ 1.859.032.675 | US$ 2.971.014.493 |
| 1999 | US$ 2.009.562.329 | US$ 826.448.700 |
| 1998 | US$ 1.920.046.181 | US$ 2.044.987.739 |
| 1997 | US$ 1.746.494.219 | US$ 913.625.815 |
| 1996 | US$ 1.849.069.201 | US$ 1.749.530.237 |
| 1995 | US$ 2.028.765.972 | US$ 1.338.976.146 |
| 1994 | US$ 1.687.427.596 | US$ 1.157.757.147 |
| 1993 | US$ 1.858.224.797 | - |
| 1992 | US$ 2.056.499.106 | - |
| 1991 | US$ 1.934.759.331 | - |
| 1990 | US$ 2.049.748.975 | - |
| 1989 | US$ 1.691.678.612 | - |
| 1988 | US$ 1.643.548.736 | - |
| 1987 | US$ 1.626.029.779 | - |
| 1986 | US$ 1.524.007.492 | - |
| 1985 | US$ 1.294.595.860 | - |
| 1984 | US$ 1.482.612.971 | - |
| 1983 | US$ 1.600.297.544 | - |
| 1982 | US$ 1.504.650.626 | - |
| 1981 | US$ 1.822.808.299 | - |
| 1980 | US$ 1.496.960.300 | - |
| 1979 | US$ 1.264.686.528 | - |
| 1978 | US$ 1.060.183.571 | - |
| 1977 | US$ 1.126.395.026 | - |
| 1976 | US$ 936.697.270 | - |
| 1975 | US$ 872.642.940 | - |
| 1974 | US$ 757.849.593 | - |
| 1973 | US$ 529.963.308 | - |
| 1972 | US$ 417.121.328 | - |
| 1971 | US$ 326.227.163 | - |
| 1970 | US$ 301.688.941 | - |
| 1969 | US$ 301.745.804 | - |
| 1968 | US$ 288.978.829 | - |
| 1967 | US$ 201.513.831 | - |
| 1966 | US$ 198.969.377 | - |
| 1965 | US$ 180.697.023 | - |
| 1964 | US$ 190.639.575 | - |
| 1963 | US$ 177.791.211 | - |
| 1962 | US$ 173.017.580 | - |
| 1961 | US$ 174.678.731 | - |
| 1960 | US$ 126.271.877 | - |
Em 2025, as importações de bens e serviços do Senegal foram de US$ 14,3 bilhões e as da República Democrática do Congo, de US$ 40 bilhões: as da República Democrática do Congo foram 2,8 vezes maiores. Em 1994, as importações do Senegal foram 46% maiores: US$ 1,69 bilhão do Senegal e US$ 1,16 bilhão da República Democrática do Congo.
As importações de bens e serviços da República Democrática do Congo têm sido maiores que as do Senegal todos os anos desde 2007.
Senegal vs República Democrática do Congo: dados de importações
|
Senegal
|
RDC
|
|
|---|---|---|
| Importações | US$ 14,3 bi (2025) | US$ 40,0 bi (2025) |
| Posição mundial | 105/174 | 69/174 |
| Participação mundial | 0,04% | 0,12% |
| % do PIB | 38,6% | 43,9% |
| Maior categoria de bens | Petróleo, gás, minérios e outras matérias-primas (32,1%, 2025) | Petróleo, gás, minérios e outras matérias-primas (34,5%, 2025) |
| Principal origem dos bens | China (14,2%, 2025) | China (34,4%, 2025) |
Comparar as importações de 2 países quaisquer
Fontes:
- Banco Mundial | Economy & Growth (1960–2025, atualizado em outubro de 2026)
- TradeMap (2001–2025, atualizado em outubro de 2026)
Creative Commons Atribuição (CC BY): você pode copiar, compartilhar, adaptar e reutilizar este conteúdo, inclusive para fins comerciais, desde que cite o statistics.wiki e indique as alterações que fizer. As fontes listadas acima podem ter suas próprias condições de licença.