
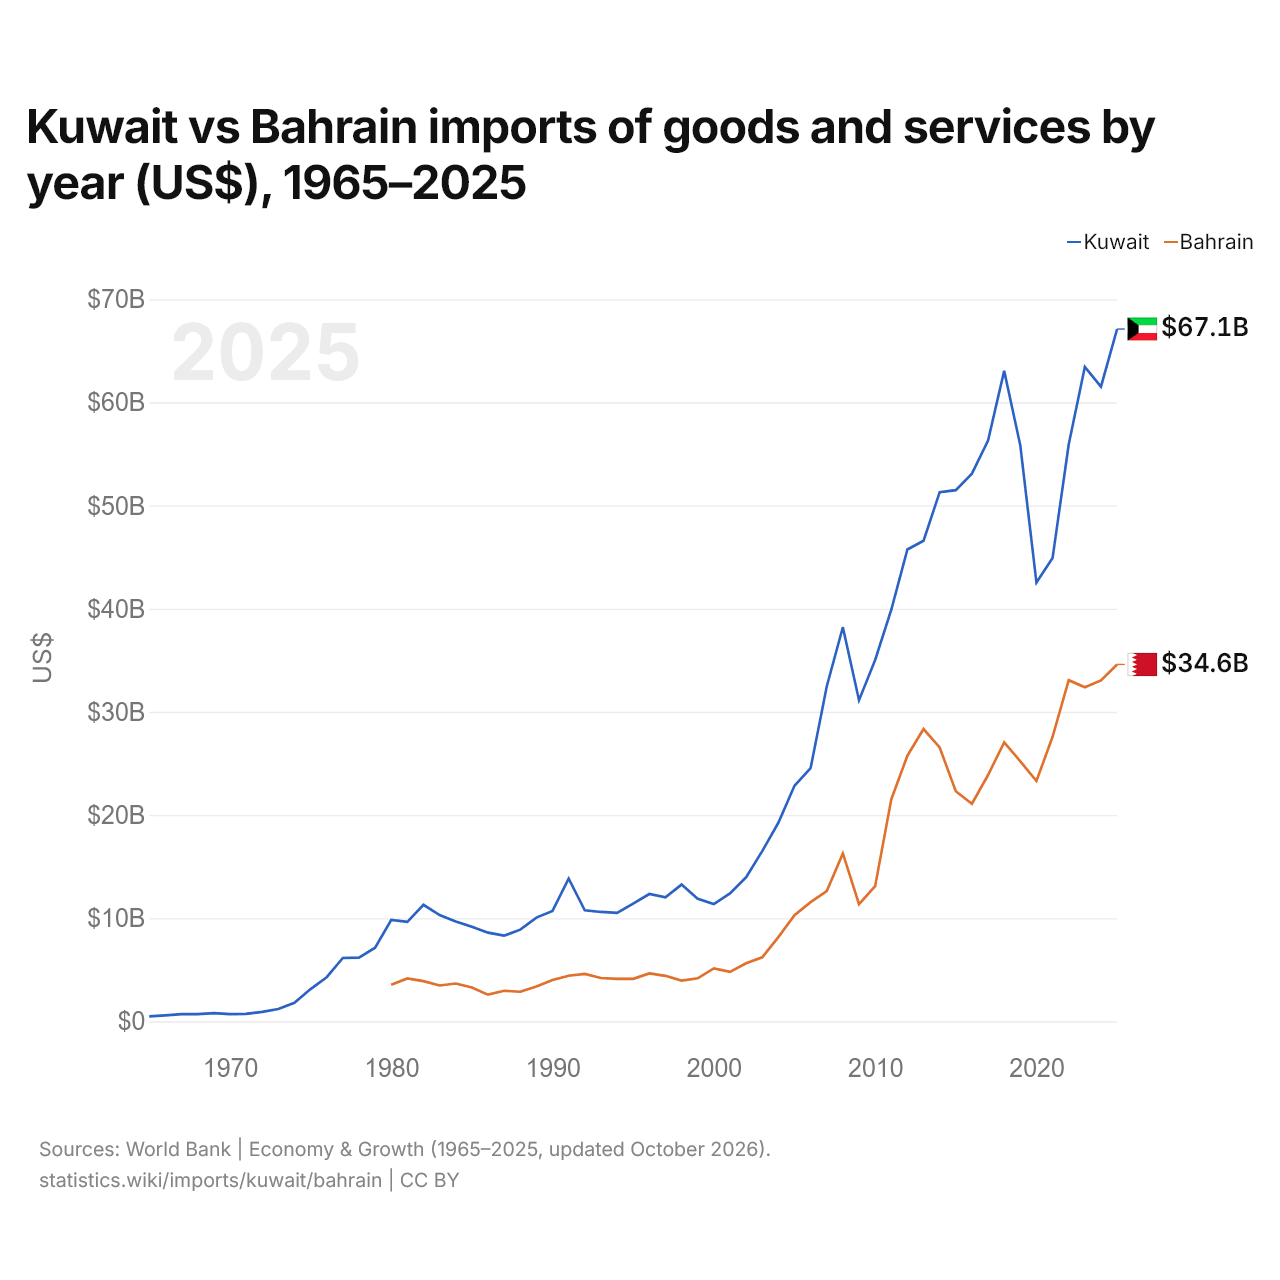
Kuwait vs Bahrein: importações de bens e serviços por ano (US$), 1965–2025
1x
| Ano | US$ | |
|---|---|---|
 Kuwait |
 Bahrein |
|
| 2025 | US$ 67.106.804.066 | US$ 34.595.398.936 |
| 2024 | US$ 61.521.205.383 | US$ 33.044.414.894 |
| 2023 | US$ 63.425.622.996 | US$ 32.379.255.319 |
| 2022 | US$ 55.913.469.388 | US$ 33.068.882.979 |
| 2021 | US$ 44.912.694.808 | US$ 27.577.393.617 |
| 2020 | US$ 42.529.707.772 | US$ 23.296.808.511 |
| 2019 | US$ 55.817.806.338 | US$ 25.207.712.766 |
| 2018 | US$ 63.048.258.687 | US$ 27.048.670.213 |
| 2017 | US$ 56.293.171.254 | US$ 23.876.329.787 |
| 2016 | US$ 53.090.012.147 | US$ 21.088.031.915 |
| 2015 | US$ 51.488.579.434 | US$ 22.301.861.702 |
| 2014 | US$ 51.286.394.768 | US$ 26.548.936.170 |
| 2013 | US$ 46.580.345.500 | US$ 28.331.382.979 |
| 2012 | US$ 45.739.026.063 | US$ 25.749.202.128 |
| 2011 | US$ 39.894.339.787 | US$ 21.506.648.936 |
| 2010 | US$ 35.034.036.154 | US$ 13.097.074.468 |
| 2009 | US$ 31.130.878.955 | US$ 11.353.989.362 |
| 2008 | US$ 38.206.585.624 | US$ 16.276.329.787 |
| 2007 | US$ 32.461.455.101 | US$ 12.626.329.787 |
| 2006 | US$ 24.543.725.187 | US$ 11.559.042.553 |
| 2005 | US$ 22.839.041.096 | US$ 10.286.968.085 |
| 2004 | US$ 19.246.691.551 | US$ 8.170.478.723 |
| 2003 | US$ 16.499.335.597 | US$ 6.205.053.191 |
| 2002 | US$ 13.961.186.388 | US$ 5.624.202.128 |
| 2001 | US$ 12.400.466.933 | US$ 4.794.680.851 |
| 2000 | US$ 11.370.749.009 | US$ 5.132.180.851 |
| 1999 | US$ 11.878.521.098 | US$ 4.168.882.979 |
| 1998 | US$ 13.256.506.845 | US$ 3.950.532.181 |
| 1997 | US$ 12.015.862.917 | US$ 4.413.031.915 |
| 1996 | US$ 12.340.978.394 | US$ 4.649.734.043 |
| 1995 | US$ 11.409.022.677 | US$ 4.122.340.426 |
| 1994 | US$ 10.518.518.519 | US$ 4.119.148.936 |
| 1993 | US$ 10.602.648.675 | US$ 4.198.138.298 |
| 1992 | US$ 10.766.871.506 | US$ 4.596.276.330 |
| 1991 | US$ 13.840.763.854 | US$ 4.414.893.617 |
| 1990 | US$ 10.701.388.542 | US$ 4.001.596.011 |
| 1989 | US$ 10.058.581.791 | US$ 3.385.638.032 |
| 1988 | US$ 8.884.381.552 | US$ 2.869.148.936 |
| 1987 | US$ 8.303.936.655 | US$ 2.964.627.660 |
| 1986 | US$ 8.596.155.818 | US$ 2.588.829.787 |
| 1985 | US$ 9.166.990.520 | US$ 3.280.851.064 |
| 1984 | US$ 9.687.160.122 | US$ 3.665.159.574 |
| 1983 | US$ 10.300.332.102 | US$ 3.471.808.777 |
| 1982 | US$ 11.298.630.132 | US$ 3.892.819.149 |
| 1981 | US$ 9.641.838.693 | US$ 4.161.702.128 |
| 1980 | US$ 9.822.528.922 | US$ 3.540.992.040 |
| 1979 | US$ 7.131.847.261 | - |
| 1978 | US$ 6.180.627.006 | - |
| 1977 | US$ 6.141.691.617 | - |
| 1976 | US$ 4.275.155.872 | - |
| 1975 | US$ 3.127.241.132 | - |
| 1974 | US$ 1.800.437.317 | - |
| 1973 | US$ 1.199.034.299 | - |
| 1972 | US$ 919.595.439 | - |
| 1971 | US$ 724.238.833 | - |
| 1970 | US$ 692.999.723 | - |
| 1969 | US$ 800.799.680 | - |
| 1968 | US$ 694.399.722 | - |
| 1967 | US$ 694.399.722 | - |
| 1966 | US$ 582.399.767 | - |
| 1965 | US$ 484.399.806 | - |
Em 2025, as importações de bens e serviços do Kuwait foram de US$ 67,1 bilhões e as do Bahrein, de US$ 34,6 bilhões: as do Kuwait foram 1,9 vezes maiores. Em 1980, as importações do Kuwait foram 2,8 vezes maiores: US$ 9,82 bilhões do Kuwait e US$ 3,54 bilhões do Bahrein.
As importações de bens e serviços do Kuwait têm sido maiores que as do Bahrein todos os anos desde 1980.
Kuwait vs Bahrein: dados de importações
|
Kuwait
|
Bahrein
|
|
|---|---|---|
| Importações | US$ 67,1 bi (2025) | US$ 34,6 bi (2025) |
| Posição mundial | 59/174 | 75/174 |
| Participação mundial | 0,2% | 0,1% |
| % do PIB | 42,7% | 70,7% |
| Maior categoria de bens | Máquinas, eletrônicos e veículos (37,1%, 2025) | Petróleo, gás, minérios e outras matérias-primas (46%, 2025) |
| Principal origem dos bens | China (20,6%, 2025) | Arábia Saudita (33,3%, 2025) |
Comparar as importações de 2 países quaisquer
Fontes:
- Banco Mundial | Economy & Growth (1965–2025, atualizado em outubro de 2026)
- TradeMap (2001–2025, atualizado em outubro de 2026)
Creative Commons Atribuição (CC BY): você pode copiar, compartilhar, adaptar e reutilizar este conteúdo, inclusive para fins comerciais, desde que cite o statistics.wiki e indique as alterações que fizer. As fontes listadas acima podem ter suas próprias condições de licença.