
Israel vs Dinamarca: PIB per capita, 1960–2025
1x
| Ano | PIB per capita, US$ correntes | |
|---|---|---|
 Israel |
 Dinamarca |
|
| 2025 | US$ 60.337 | US$ 76.970 |
| 2024 | US$ 54.217 | US$ 71.026 |
| 2023 | US$ 52.126 | US$ 68.044 |
| 2022 | US$ 54.947 | US$ 67.781 |
| 2021 | US$ 52.258 | US$ 69.341 |
| 2020 | US$ 44.591 | US$ 60.985 |
| 2019 | US$ 44.092 | US$ 59.404 |
| 2018 | US$ 42.269 | US$ 61.325 |
| 2017 | US$ 41.013 | US$ 57.522 |
| 2016 | US$ 37.571 | US$ 54.501 |
| 2015 | US$ 36.138 | US$ 53.094 |
| 2014 | US$ 38.265 | US$ 62.520 |
| 2013 | US$ 36.981 | US$ 61.378 |
| 2012 | US$ 33.269 | US$ 58.444 |
| 2011 | US$ 34.477 | US$ 61.810 |
| 2010 | US$ 31.399 | US$ 58.105 |
| 2009 | US$ 28.470 | US$ 58.413 |
| 2008 | US$ 30.231 | US$ 64.617 |
| 2007 | US$ 25.689 | US$ 58.632 |
| 2006 | US$ 22.500 | US$ 52.119 |
| 2005 | US$ 21.262 | US$ 48.926 |
| 2004 | US$ 20.550 | US$ 46.625 |
| 2003 | US$ 19.624 | US$ 40.519 |
| 2002 | US$ 19.059 | US$ 33.257 |
| 2001 | US$ 20.949 | US$ 30.768 |
| 2000 | US$ 21.690 | US$ 30.722 |
| 1999 | US$ 19.809 | US$ 33.426 |
| 1998 | US$ 20.176 | US$ 33.346 |
| 1997 | US$ 20.457 | US$ 32.780 |
| 1996 | US$ 20.213 | US$ 35.622 |
| 1995 | US$ 19.014 | US$ 35.321 |
| 1994 | US$ 16.796 | US$ 29.968 |
| 1993 | US$ 15.169 | US$ 27.582 |
| 1992 | US$ 15.500 | US$ 29.579 |
| 1991 | US$ 14.337 | US$ 27.003 |
| 1990 | US$ 13.300 | US$ 26.886 |
| 1989 | US$ 11.601 | US$ 21.882 |
| 1988 | US$ 11.846 | US$ 22.525 |
| 1987 | US$ 9.847 | US$ 21.296 |
| 1986 | US$ 8.330 | US$ 17.137 |
| 1985 | US$ 6.824 | US$ 12.213 |
| 1984 | US$ 7.364 | US$ 11.517 |
| 1983 | US$ 7.955 | US$ 11.797 |
| 1982 | US$ 7.253 | US$ 11.740 |
| 1981 | US$ 6.791 | US$ 12.000 |
| 1980 | US$ 6.545 | US$ 13.822 |
| 1979 | US$ 5.968 | US$ 13.757 |
| 1978 | US$ 4.794 | US$ 11.818 |
| 1977 | US$ 5.050 | US$ 9.770 |
| 1976 | US$ 4.514 | US$ 8.773 |
| 1975 | US$ 4.669 | US$ 7.988 |
| 1974 | US$ 5.082 | US$ 6.764 |
| 1973 | US$ 3.629 | US$ 6.117 |
| 1972 | US$ 2.928 | US$ 4.654 |
| 1971 | US$ 2.297 | US$ 3.846 |
| 1970 | US$ 2.489 | US$ 3.464 |
| 1969 | US$ 2.188 | US$ 3.151 |
| 1968 | US$ 1.946 | US$ 2.776 |
| 1967 | US$ 1.734 | US$ 2.701 |
| 1966 | US$ 1.788 | US$ 2.487 |
| 1965 | US$ 1.688 | US$ 2.284 |
| 1964 | US$ 1.625 | US$ 2.049 |
| 1963 | US$ 1.485 | US$ 1.807 |
| 1962 | US$ 1.293 | US$ 1.711 |
| 1961 | US$ 1.696 | US$ 1.531 |
| 1960 | US$ 1.452 | US$ 1.389 |
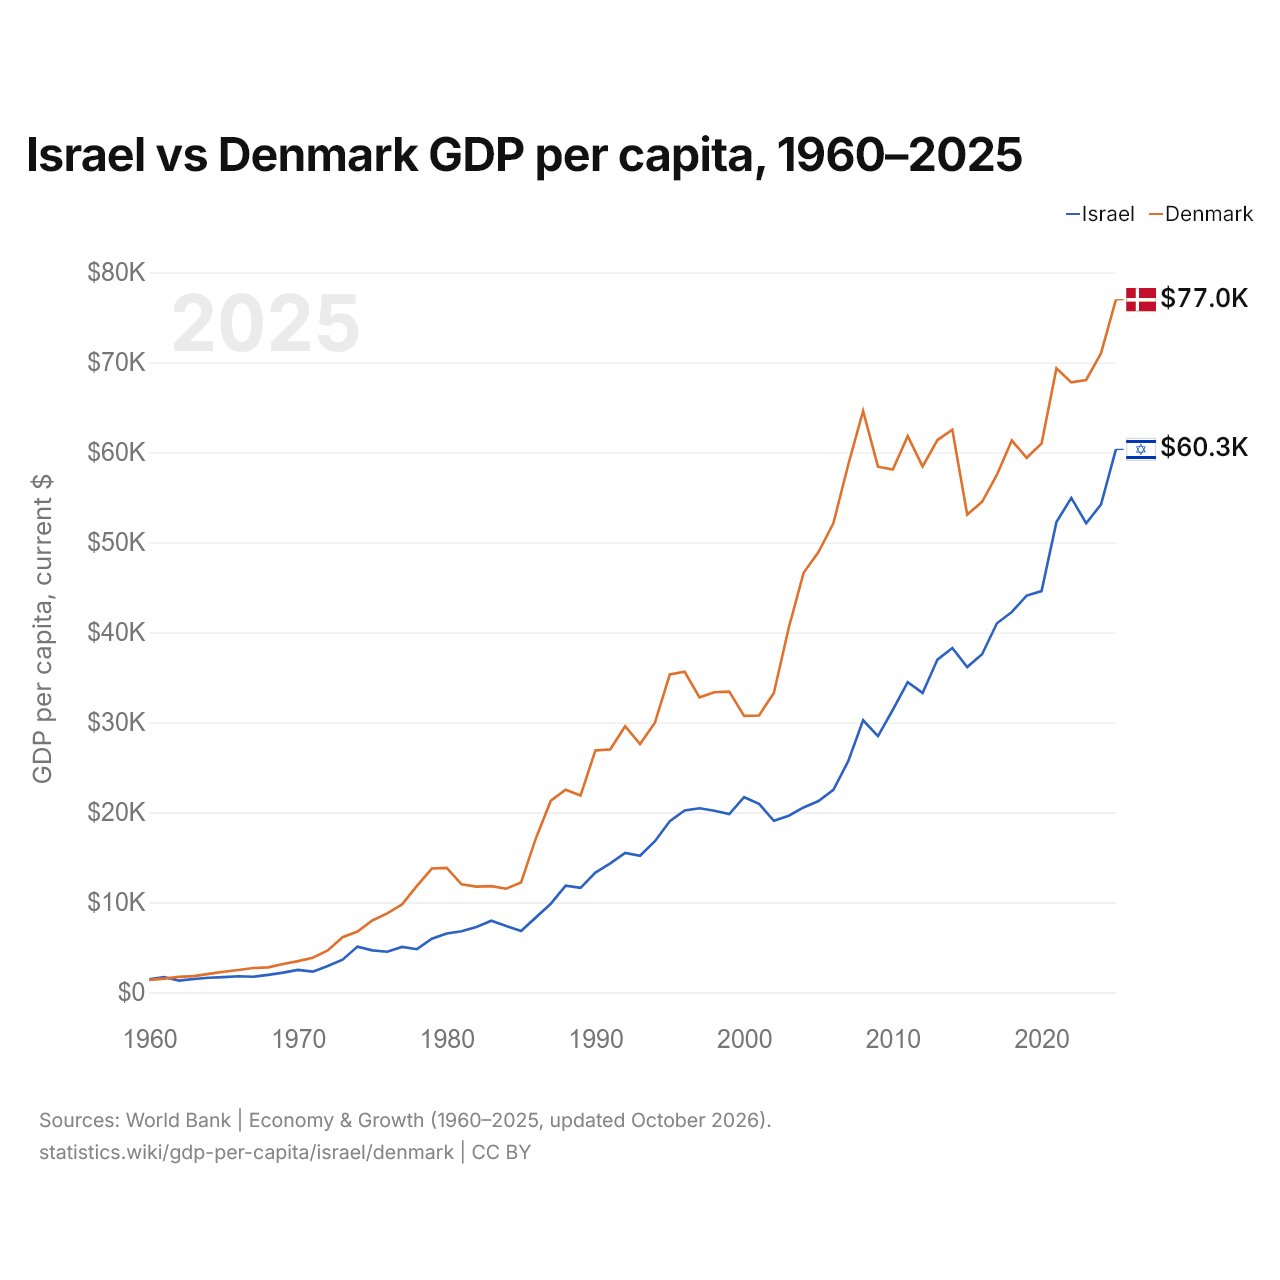
Em 2025, o PIB per capita foi de US$ 60.337 em Israel e de US$ 76.970 na Dinamarca: 28% maior na Dinamarca. Em 1960, era de US$ 1.452 em Israel e de US$ 1.389 na Dinamarca, 4,5% maior em Israel.
O PIB per capita da Dinamarca tem sido mais alto que o de Israel todos os anos desde 1962. A preços constantes de 2015, o PIB per capita de Israel em 2025 foi 4,8 vezes o de 1960, e o da Dinamarca, 3,6 vezes.
Israel vs Dinamarca: dados mais recentes do PIB per capita
|
Israel
|
Dinamarca
|
|
|---|---|---|
| PIB per capita, US$ correntes | US$ 60.337 | US$ 76.970 |
| Posição mundial | 19/197 | 11/197 |
| PIB per capita, US$ constantes de 2015 | US$ 42.596 | US$ 62.218 |
| × média mundial | 4,19× | 5,34× |
| Diferença de PIB per capita | 0,78× | 1,3× |
Comparar o PIB per capita de 2 países quaisquer
Fontes:
- Banco Mundial | Economy & Growth (1960–2025, atualizado em outubro de 2026)
Creative Commons Atribuição (CC BY): você pode copiar, compartilhar, adaptar e reutilizar este conteúdo, inclusive para fins comerciais, desde que cite o statistics.wiki e indique as alterações que fizer. As fontes listadas acima podem ter suas próprias condições de licença.