
Israel vs Austrália: PIB per capita, 1960–2025
1x
| Ano | PIB per capita, US$ correntes | |
|---|---|---|
 Israel |
 Austrália |
|
| 2025 | US$ 60.337 | US$ 65.130 |
| 2024 | US$ 54.217 | US$ 64.610 |
| 2023 | US$ 52.126 | US$ 65.058 |
| 2022 | US$ 54.947 | US$ 65.170 |
| 2021 | US$ 52.258 | US$ 60.759 |
| 2020 | US$ 44.591 | US$ 51.983 |
| 2019 | US$ 44.092 | US$ 55.195 |
| 2018 | US$ 42.269 | US$ 57.410 |
| 2017 | US$ 41.013 | US$ 54.118 |
| 2016 | US$ 37.571 | US$ 50.084 |
| 2015 | US$ 36.138 | US$ 56.970 |
| 2014 | US$ 38.265 | US$ 62.817 |
| 2013 | US$ 36.981 | US$ 68.477 |
| 2012 | US$ 33.269 | US$ 68.301 |
| 2011 | US$ 34.477 | US$ 62.799 |
| 2010 | US$ 31.399 | US$ 52.314 |
| 2009 | US$ 28.470 | US$ 42.955 |
| 2008 | US$ 30.231 | US$ 49.811 |
| 2007 | US$ 25.689 | US$ 41.128 |
| 2006 | US$ 22.500 | US$ 36.659 |
| 2005 | US$ 21.262 | US$ 34.535 |
| 2004 | US$ 20.550 | US$ 30.886 |
| 2003 | US$ 19.624 | US$ 23.758 |
| 2002 | US$ 19.059 | US$ 20.335 |
| 2001 | US$ 20.949 | US$ 19.734 |
| 2000 | US$ 21.690 | US$ 21.909 |
| 1999 | US$ 19.809 | US$ 20.750 |
| 1998 | US$ 20.176 | US$ 21.516 |
| 1997 | US$ 20.457 | US$ 23.683 |
| 1996 | US$ 20.213 | US$ 22.056 |
| 1995 | US$ 19.014 | US$ 20.479 |
| 1994 | US$ 16.796 | US$ 18.156 |
| 1993 | US$ 15.169 | US$ 17.725 |
| 1992 | US$ 15.500 | US$ 18.650 |
| 1991 | US$ 14.337 | US$ 18.885 |
| 1990 | US$ 13.300 | US$ 18.274 |
| 1989 | US$ 11.601 | US$ 17.858 |
| 1988 | US$ 11.846 | US$ 14.303 |
| 1987 | US$ 9.847 | US$ 11.666 |
| 1986 | US$ 8.330 | US$ 11.406 |
| 1985 | US$ 6.824 | US$ 11.455 |
| 1984 | US$ 7.364 | US$ 12.436 |
| 1983 | US$ 7.955 | US$ 11.532 |
| 1982 | US$ 7.253 | US$ 12.798 |
| 1981 | US$ 6.791 | US$ 11.871 |
| 1980 | US$ 6.545 | US$ 10.223 |
| 1979 | US$ 5.968 | US$ 9.308 |
| 1978 | US$ 4.794 | US$ 8.264 |
| 1977 | US$ 5.050 | US$ 7.786 |
| 1976 | US$ 4.514 | US$ 7.497 |
| 1975 | US$ 4.669 | US$ 7.014 |
| 1974 | US$ 5.082 | US$ 6.492 |
| 1973 | US$ 3.629 | US$ 4.778 |
| 1972 | US$ 2.928 | US$ 3.955 |
| 1971 | US$ 2.297 | US$ 3.500 |
| 1970 | US$ 2.489 | US$ 3.310 |
| 1969 | US$ 2.188 | US$ 2.996 |
| 1968 | US$ 1.946 | US$ 2.728 |
| 1967 | US$ 1.734 | US$ 2.584 |
| 1966 | US$ 1.788 | US$ 2.347 |
| 1965 | US$ 1.688 | US$ 2.284 |
| 1964 | US$ 1.625 | US$ 2.134 |
| 1963 | US$ 1.485 | US$ 1.970 |
| 1962 | US$ 1.293 | US$ 1.858 |
| 1961 | US$ 1.696 | US$ 1.880 |
| 1960 | US$ 1.452 | US$ 1.813 |
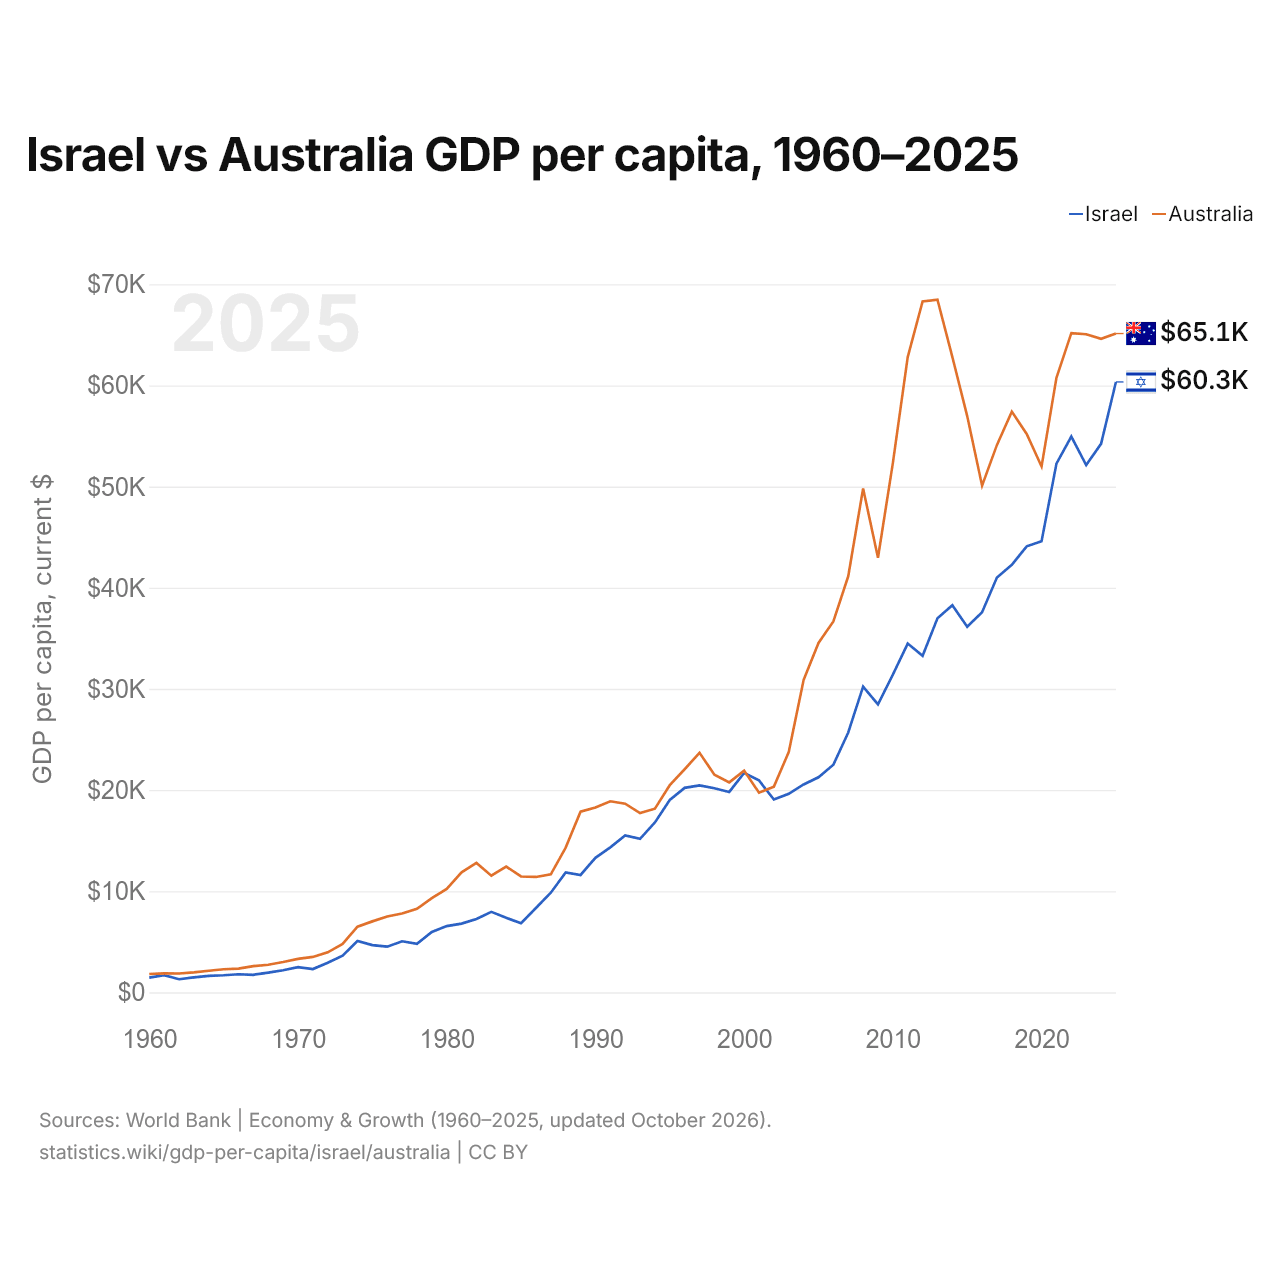
Em 2025, o PIB per capita foi de US$ 60.337 em Israel e de US$ 65.130 na Austrália: 7,9% maior na Austrália. Em 1960, era de US$ 1.452 em Israel e de US$ 1.813 na Austrália, 25% maior na Austrália.
O PIB per capita da Austrália tem sido mais alto que o de Israel todos os anos desde 2002. A preços constantes de 2015, o PIB per capita de Israel em 2025 foi 4,8 vezes o de 1960, e o da Austrália, 3,1 vezes.
Israel vs Austrália: dados mais recentes do PIB per capita
|
Israel
|
Austrália
|
|
|---|---|---|
| PIB per capita, US$ correntes | US$ 60.337 | US$ 65.130 |
| Posição mundial | 19/197 | 14/197 |
| PIB per capita, US$ constantes de 2015 | US$ 42.596 | US$ 61.369 |
| × média mundial | 4,19× | 4,52× |
| Diferença de PIB per capita | 0,93× | 1,1× |
Comparar o PIB per capita de 2 países quaisquer
Fontes:
- Banco Mundial | Economy & Growth (1960–2025, atualizado em outubro de 2026)
Creative Commons Atribuição (CC BY): você pode copiar, compartilhar, adaptar e reutilizar este conteúdo, inclusive para fins comerciais, desde que cite o statistics.wiki e indique as alterações que fizer. As fontes listadas acima podem ter suas próprias condições de licença.