
PIB per capita de Portugal, 1960–2025
| Ano | PIB per capita | Posição mundial | |
|---|---|---|---|
| US$ correntes | US$ constantes de 2015 | ||
| 2025 | US$ 32.082 | US$ 22.851 | #43 |
| 2024 | US$ 29.328 | US$ 22.664 | #44 |
| 2023 | US$ 27.635 | US$ 22.417 | #43 |
| 2022 | US$ 24.621 | US$ 22.043 | #43 |
| 2021 | US$ 24.711 | US$ 20.748 | #42 |
| 2020 | US$ 22.299 | US$ 19.779 | #42 |
| 2019 | US$ 23.343 | US$ 21.569 | #43 |
| 2018 | US$ 23.541 | US$ 20.998 | #42 |
| 2017 | US$ 21.442 | US$ 20.364 | #41 |
| 2016 | US$ 19.980 | US$ 19.663 | #42 |
| 2015 | US$ 19.216 | US$ 19.216 | #44 |
| 2014 | US$ 22.121 | US$ 18.837 | #41 |
| 2013 | US$ 21.676 | US$ 18.598 | #41 |
| 2012 | US$ 20.593 | US$ 18.680 | #43 |
| 2011 | US$ 23.247 | US$ 19.390 | #42 |
| 2010 | US$ 22.552 | US$ 19.699 | #39 |
| 2009 | US$ 23.151 | US$ 19.371 | #37 |
| 2008 | US$ 24.949 | US$ 20.014 | #38 |
| 2007 | US$ 22.811 | US$ 19.980 | #37 |
| 2006 | US$ 19.839 | US$ 19.529 | #36 |
| 2005 | US$ 18.780 | US$ 19.252 | #35 |
| 2004 | US$ 18.064 | US$ 19.138 | #34 |
| 2003 | US$ 15.798 | US$ 18.847 | #35 |
| 2002 | US$ 12.937 | US$ 19.095 | #38 |
| 2001 | US$ 11.735 | US$ 19.053 | #38 |
| 2000 | US$ 11.526 | US$ 18.822 | #41 |
| 1999 | US$ 12.475 | US$ 18.258 | #35 |
| 1998 | US$ 12.199 | US$ 17.671 | #35 |
| 1997 | US$ 11.576 | US$ 16.946 | #37 |
| 1996 | US$ 12.185 | US$ 16.304 | #34 |
| 1995 | US$ 11.781 | US$ 15.812 | #35 |
| 1994 | US$ 9.977 | US$ 15.215 | #37 |
| 1993 | US$ 9.535 | US$ 15.110 | #36 |
| 1992 | US$ 10.811 | US$ 15.444 | #34 |
| 1991 | US$ 8.959 | US$ 15.266 | #35 |
| 1990 | US$ 7.885 | US$ 14.593 | #38 |
| 1989 | US$ 6.056 | US$ 14.008 | #38 |
| 1988 | US$ 5.624 | US$ 13.141 | #40 |
| 1987 | US$ 4.804 | US$ 12.213 | #42 |
| 1986 | US$ 3.862 | US$ 11.477 | #47 |
| 1985 | US$ 2.705 | US$ 11.031 | #53 |
| 1984 | US$ 2.523 | US$ 10.759 | #53 |
| 1983 | US$ 2.735 | US$ 11.008 | #53 |
| 1982 | US$ 3.080 | US$ 11.078 | #45 |
| 1981 | US$ 3.246 | US$ 10.913 | #45 |
| 1980 | US$ 3.368 | US$ 10.833 | #45 |
| 1979 | US$ 2.756 | US$ 10.470 | #43 |
| 1978 | US$ 2.457 | US$ 10.018 | #43 |
| 1977 | US$ 2.267 | US$ 9.849 | #41 |
| 1976 | US$ 2.173 | US$ 9.426 | #41 |
| 1975 | US$ 2.128 | US$ 9.072 | #40 |
| 1974 | US$ 2.000 | US$ 9.852 | #41 |
| 1973 | US$ 1.748 | US$ 9.877 | #37 |
| 1972 | US$ 1.302 | US$ 8.885 | #37 |
| 1971 | US$ 1.065 | US$ 8.213 | #41 |
| 1970 | US$ 934 | US$ 7.670 | #41 |
| 1969 | US$ 832 | US$ 6.967 | #33 |
| 1968 | US$ 752 | US$ 6.761 | #35 |
| 1967 | US$ 676 | US$ 6.184 | #35 |
| 1966 | US$ 601 | US$ 5.714 | #37 |
| 1965 | US$ 545 | US$ 5.449 | #38 |
| 1964 | US$ 490 | US$ 5.049 | #36 |
| 1963 | US$ 452 | US$ 4.752 | #37 |
| 1962 | US$ 426 | US$ 4.507 | #36 |
| 1961 | US$ 400 | US$ 4.258 | #35 |
| 1960 | US$ 377 | US$ 4.067 | #38 |
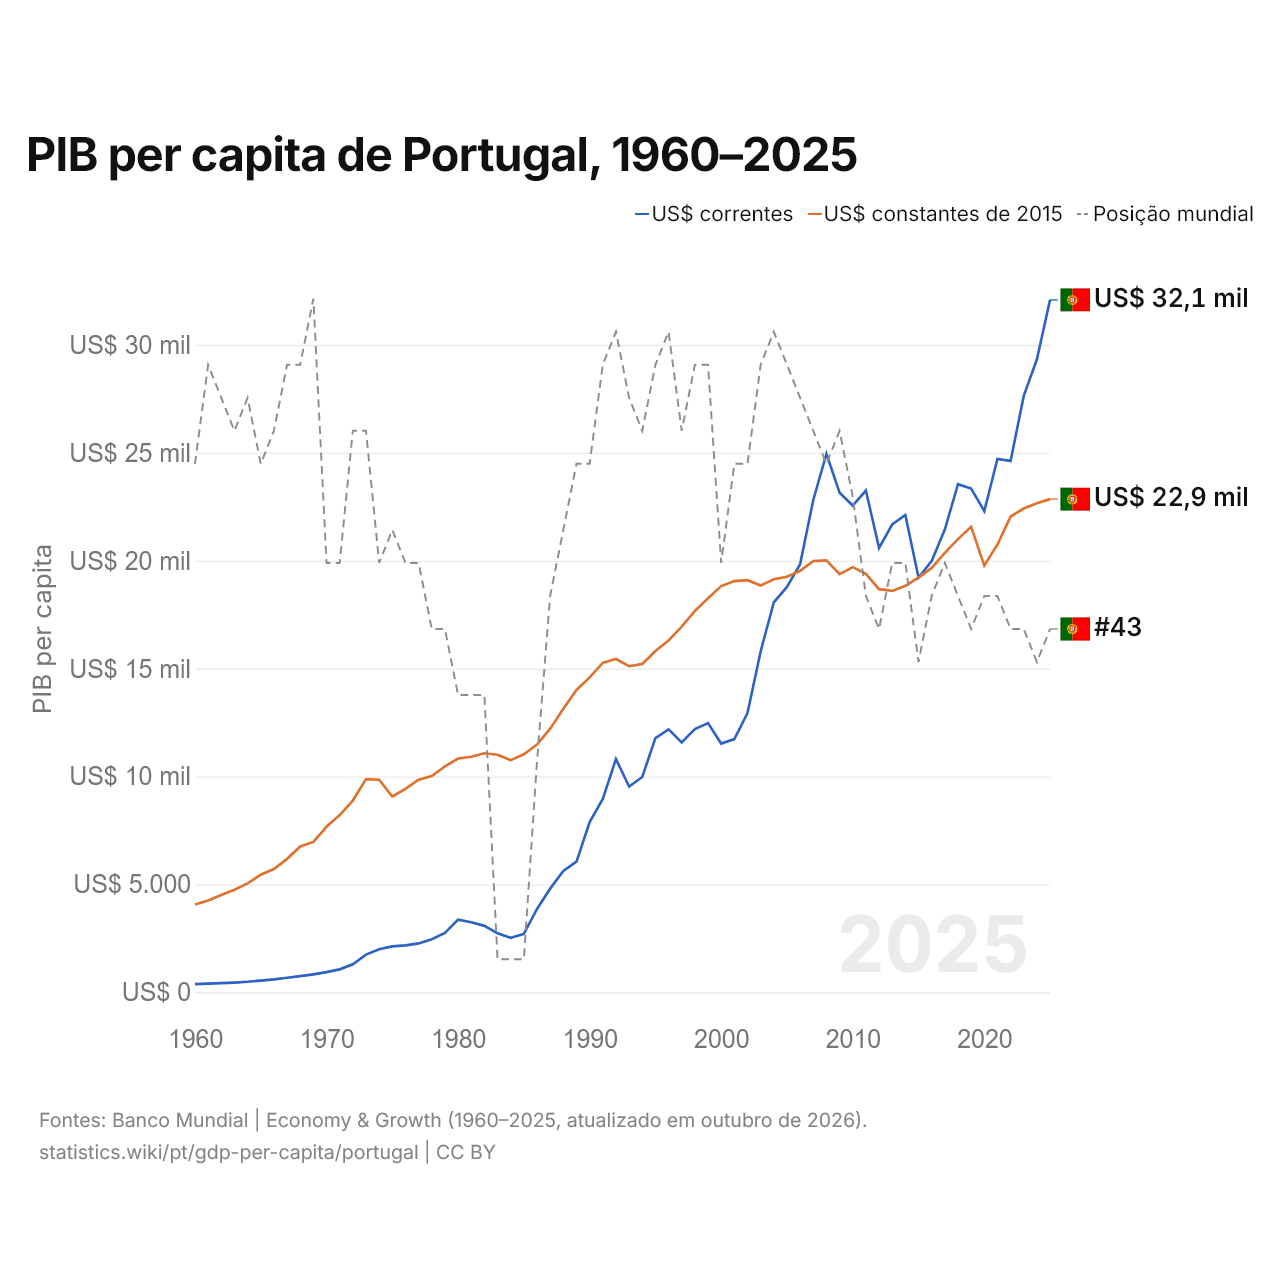
Em 2025, o PIB per capita de Portugal foi de US$ 32.082, acima dos US$ 377 de 1960. O de Portugal equivalia a 2,2 vezes o PIB per capita mundial, de US$ 14.406. Foi o 43º maior do mundo; em 2024, era o 44º. Sua melhor posição foi o 33º lugar, ocupado pela última vez em 1969. A preços constantes de 2015, o PIB per capita cresceu 0,8% em 2025 e 18,9% nos dez anos desde 2015.
A preços constantes de 2015, o PIB per capita de Portugal em 2025 foi 5,6 vezes o de 1960, um crescimento médio de 2,7% ao ano. Desde 1960, por décadas, o PIB per capita de Portugal cresceu mais rápido de 1960 a 1970, 6,5% ao ano, e mais lento de 2010 a 2020, 0,0% ao ano.
O PIB per capita de Portugal foi o 26º mais alto dos 45 países da Europa, onde ia de US$ 5.496 na Ucrânia a US$ 288.002 em Mônaco (2024). O PIB per capita (PPC) de Portugal foi de 53.146 dólares em 2025, o 43º mais alto do mundo.
Portugal na classificação mundial do PIB per capita, 2025
| Posição | País | PIB per capita | × média mundial | |
|---|---|---|---|---|
| 40 |
 Guiana |
US$ 32.414 | 2,25× | vs Guiana |
| 41 |
 Kuwait |
US$ 32.312 | 2,24× | vs Kuwait |
| 42 |
 Brunei |
US$ 32.235 | 2,24× | |
| 43 |
 Portugal |
US$ 32.082 | 2,23× | |
| 44 |
 Bahrein |
US$ 30.597 | 2,12× | vs Bahrein |
| 45 |
 Chipre |
US$ 30.075 | 2,09× | vs Chipre |
| 46 |
 Eslováquia |
US$ 28.544 | 1,98× | vs Eslováquia |
Comparar o PIB per capita de Portugal com outros países
Fontes:
- Banco Mundial | Economy & Growth (1960–2025, atualizado em outubro de 2026)
Creative Commons Atribuição (CC BY): você pode copiar, compartilhar, adaptar e reutilizar este conteúdo, inclusive para fins comerciais, desde que cite o statistics.wiki e indique as alterações que fizer. As fontes listadas acima podem ter suas próprias condições de licença.