
Portugal vs Liechtenstein: PIB per capita, 1960–2025
1x
| Ano | PIB per capita, US$ correntes | |
|---|---|---|
 Portugal |
 Liechtenstein |
|
| 2025 | US$ 32.082 | - |
| 2024 | US$ 29.328 | US$ 220.167 |
| 2023 | US$ 27.635 | US$ 206.781 |
| 2022 | US$ 24.621 | US$ 188.055 |
| 2021 | US$ 24.711 | US$ 201.945 |
| 2020 | US$ 22.299 | US$ 164.671 |
| 2019 | US$ 23.343 | US$ 166.908 |
| 2018 | US$ 23.541 | US$ 174.989 |
| 2017 | US$ 21.442 | US$ 170.547 |
| 2016 | US$ 19.980 | US$ 165.375 |
| 2015 | US$ 19.216 | US$ 167.187 |
| 2014 | US$ 22.121 | US$ 178.735 |
| 2013 | US$ 21.676 | US$ 172.824 |
| 2012 | US$ 20.593 | US$ 148.842 |
| 2011 | US$ 23.247 | US$ 158.066 |
| 2010 | US$ 22.552 | US$ 141.090 |
| 2009 | US$ 23.151 | US$ 126.025 |
| 2008 | US$ 24.949 | US$ 143.249 |
| 2007 | US$ 22.811 | US$ 130.493 |
| 2006 | US$ 19.839 | US$ 114.168 |
| 2005 | US$ 18.780 | US$ 105.295 |
| 2004 | US$ 18.064 | US$ 100.281 |
| 2003 | US$ 15.798 | US$ 90.108 |
| 2002 | US$ 12.937 | US$ 79.795 |
| 2001 | US$ 11.735 | US$ 75.068 |
| 2000 | US$ 11.526 | US$ 76.088 |
| 1999 | US$ 12.475 | US$ 82.682 |
| 1998 | US$ 12.199 | US$ 78.303 |
| 1997 | US$ 11.576 | US$ 73.591 |
| 1996 | US$ 12.185 | US$ 80.689 |
| 1995 | US$ 11.781 | US$ 78.910 |
| 1994 | US$ 9.977 | US$ 63.936 |
| 1993 | US$ 9.535 | US$ 55.605 |
| 1992 | US$ 10.811 | US$ 55.057 |
| 1991 | US$ 8.959 | US$ 50.812 |
| 1990 | US$ 7.885 | US$ 49.458 |
| 1989 | US$ 6.056 | US$ 39.552 |
| 1988 | US$ 5.624 | US$ 41.569 |
| 1987 | US$ 4.804 | US$ 38.206 |
| 1986 | US$ 3.862 | US$ 28.613 |
| 1985 | US$ 2.705 | US$ 19.684 |
| 1984 | US$ 2.523 | US$ 18.898 |
| 1983 | US$ 2.735 | US$ 19.815 |
| 1982 | US$ 3.080 | US$ 19.886 |
| 1981 | US$ 3.246 | US$ 19.929 |
| 1980 | US$ 3.368 | US$ 20.959 |
| 1979 | US$ 2.756 | US$ 19.674 |
| 1978 | US$ 2.457 | US$ 17.457 |
| 1977 | US$ 2.267 | US$ 12.417 |
| 1976 | US$ 2.173 | US$ 11.326 |
| 1975 | US$ 2.128 | US$ 10.333 |
| 1974 | US$ 2.000 | US$ 8.272 |
| 1973 | US$ 1.748 | US$ 7.282 |
| 1972 | US$ 1.302 | US$ 5.645 |
| 1971 | US$ 1.065 | US$ 4.856 |
| 1970 | US$ 934 | US$ 4.262 |
| 1969 | US$ 832 | - |
| 1968 | US$ 752 | - |
| 1967 | US$ 676 | - |
| 1966 | US$ 601 | - |
| 1965 | US$ 545 | - |
| 1964 | US$ 490 | - |
| 1963 | US$ 452 | - |
| 1962 | US$ 426 | - |
| 1961 | US$ 400 | - |
| 1960 | US$ 377 | - |
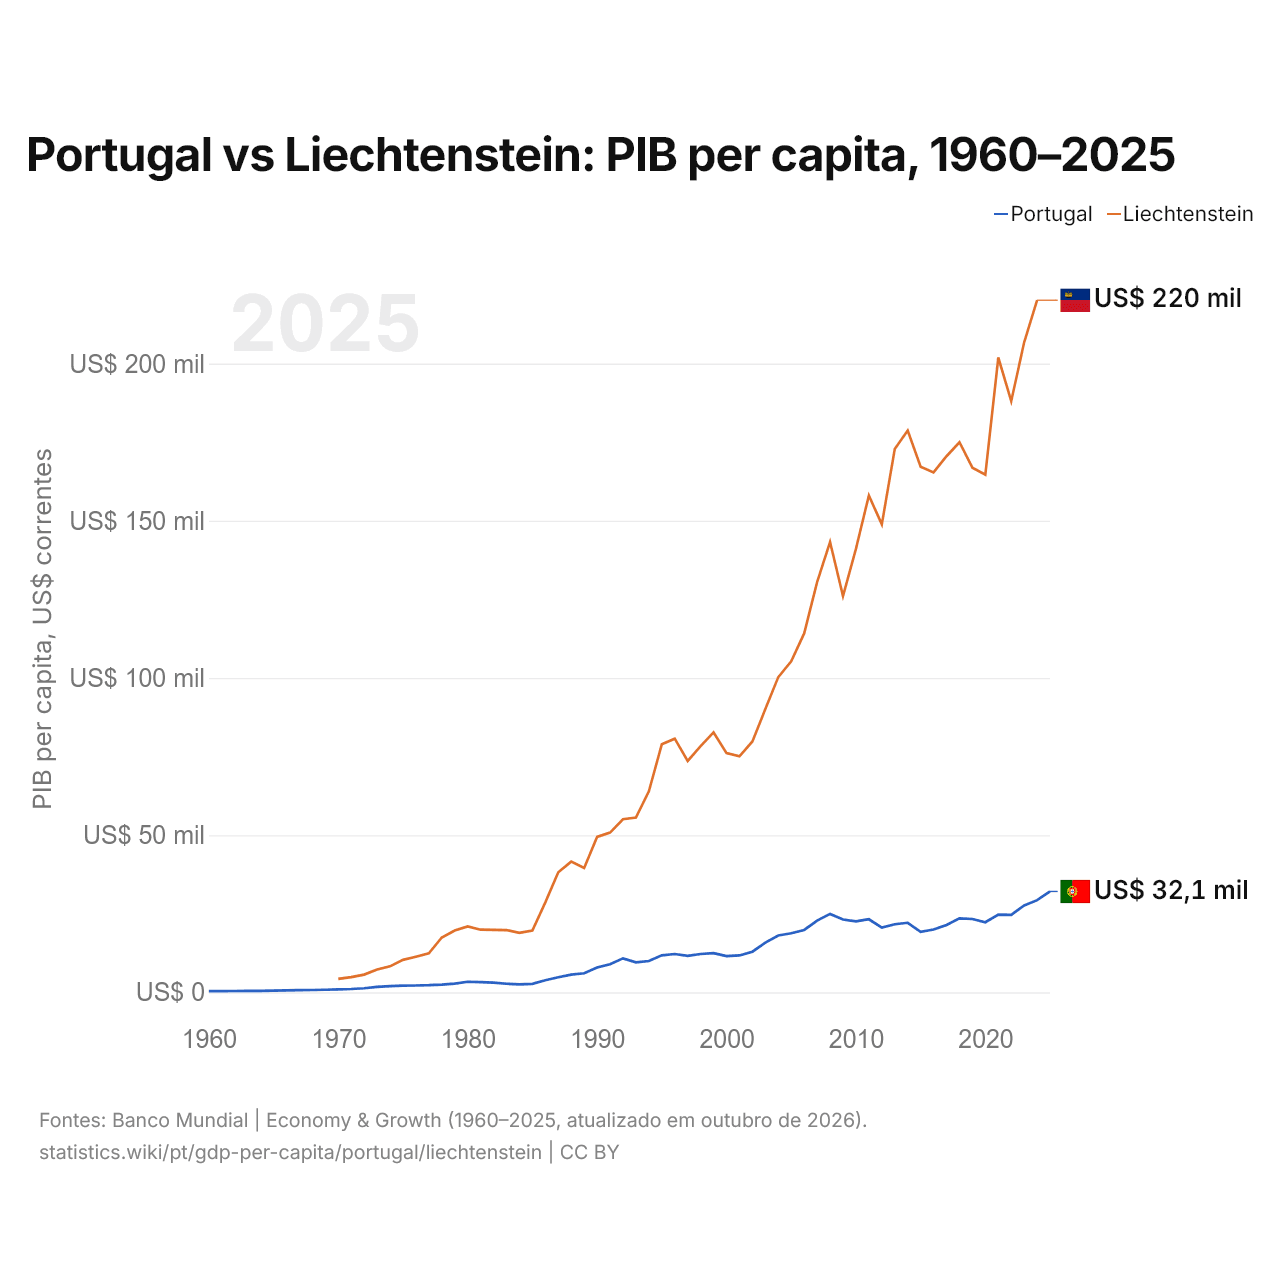
O PIB per capita foi de US$ 29.328 em Portugal (2024) e de US$ 220.167 no Liechtenstein (2024): 7,5 vezes maior no Liechtenstein. Em 1970, era de US$ 934 em Portugal e de US$ 4.262 no Liechtenstein, 4,6 vezes maior no Liechtenstein.
O PIB per capita do Liechtenstein tem sido mais alto que o de Portugal todos os anos desde 1970.
Portugal vs Liechtenstein: dados mais recentes do PIB per capita
|
Portugal
|
Liechtenstein
|
|
|---|---|---|
| PIB per capita, US$ correntes | US$ 32.082 (2025) | US$ 220.167 (2024) |
| Posição mundial | 43/197 | 2/197 |
| × média mundial | 2,23× | 16,1× |
Comparar o PIB per capita de 2 países quaisquer
Fontes:
- Banco Mundial | Economy & Growth (1960–2025, atualizado em outubro de 2026)
Creative Commons Atribuição (CC BY): você pode copiar, compartilhar, adaptar e reutilizar este conteúdo, inclusive para fins comerciais, desde que cite o statistics.wiki e indique as alterações que fizer. As fontes listadas acima podem ter suas próprias condições de licença.