
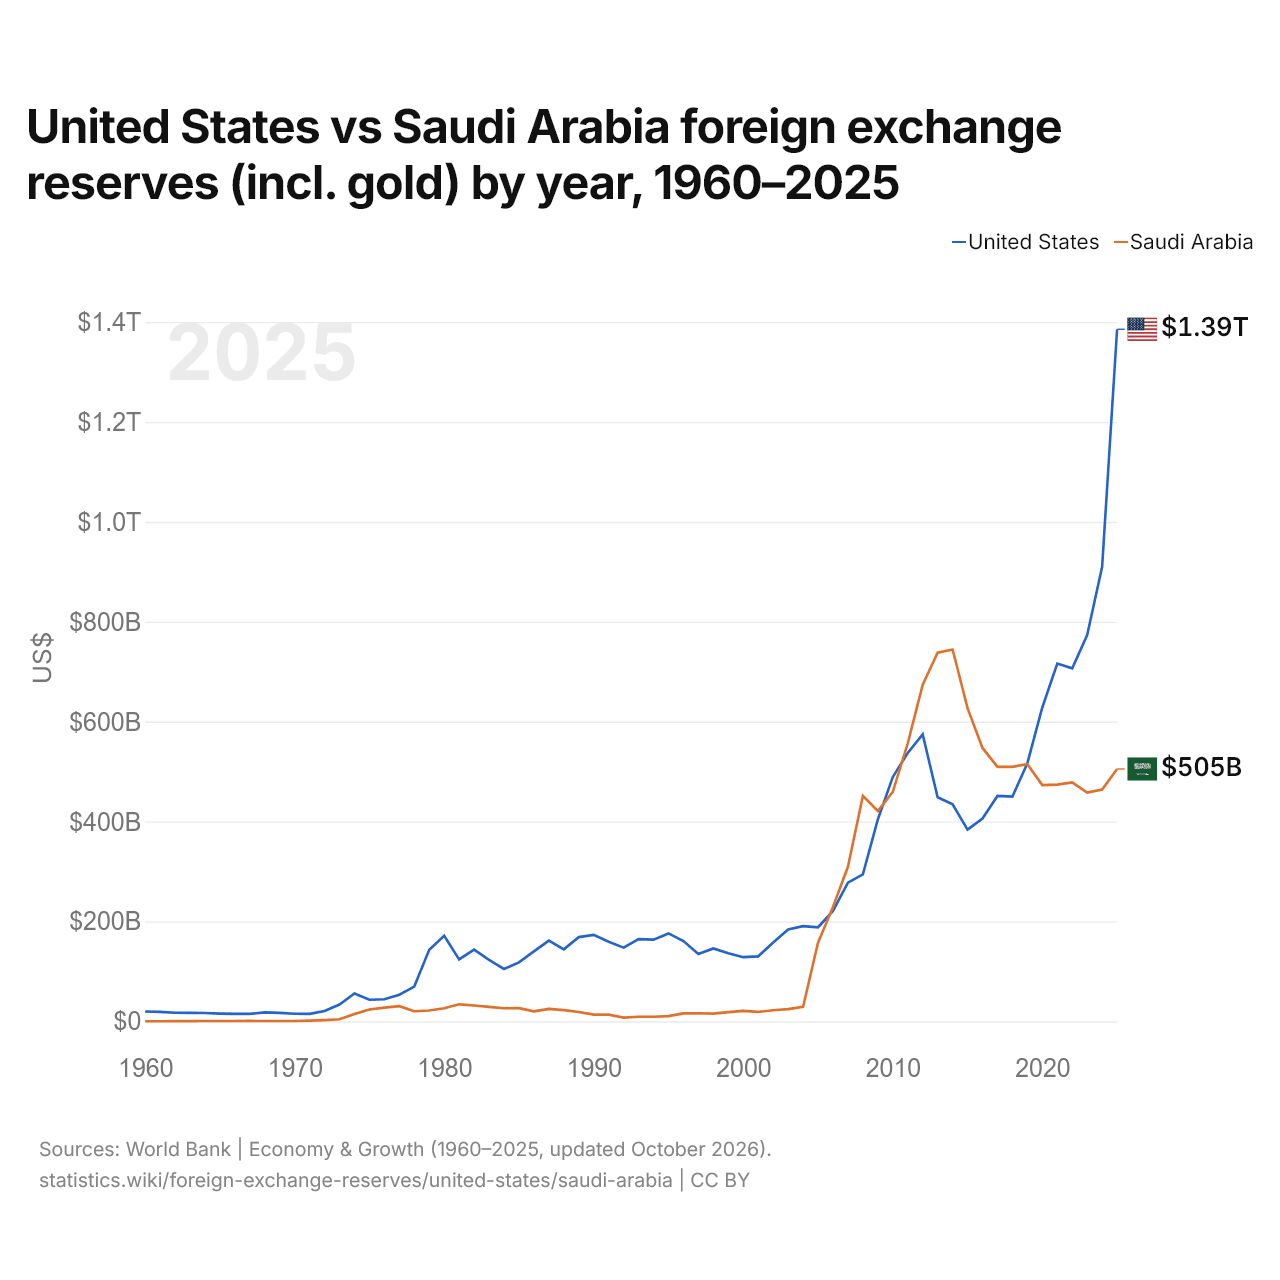
Estados Unidos vs Arábia Saudita: reservas internacionais (incluindo ouro) por ano, 1960–2025
| Ano | US$ | |
|---|---|---|
 Estados Unidos |
 Arábia Saudita |
|
| 2025 | US$ 1.385.447.111.477 | US$ 505.163.993.095 |
| 2024 | US$ 910.036.546.652 | US$ 463.869.589.071 |
| 2023 | US$ 773.426.187.289 | US$ 457.948.635.287 |
| 2022 | US$ 706.644.215.999 | US$ 478.231.707.666 |
| 2021 | US$ 716.152.260.974 | US$ 473.889.603.513 |
| 2020 | US$ 628.369.715.338 | US$ 472.850.970.845 |
| 2019 | US$ 516.700.583.371 | US$ 514.962.537.825 |
| 2018 | US$ 449.907.088.829 | US$ 509.468.527.336 |
| 2017 | US$ 451.285.263.406 | US$ 509.457.096.430 |
| 2016 | US$ 405.942.428.720 | US$ 547.266.635.919 |
| 2015 | US$ 383.728.497.570 | US$ 626.989.686.478 |
| 2014 | US$ 434.416.188.745 | US$ 744.440.513.643 |
| 2013 | US$ 448.508.920.738 | US$ 737.796.355.078 |
| 2012 | US$ 574.268.084.132 | US$ 673.739.616.018 |
| 2011 | US$ 537.267.041.107 | US$ 556.570.950.256 |
| 2010 | US$ 488.928.508.742 | US$ 459.313.194.915 |
| 2009 | US$ 404.098.925.258 | US$ 420.983.696.036 |
| 2008 | US$ 294.045.673.780 | US$ 451.278.977.578 |
| 2007 | US$ 277.548.941.769 | US$ 309.287.347.097 |
| 2006 | US$ 221.088.725.059 | US$ 228.956.885.016 |
| 2005 | US$ 188.259.141.662 | US$ 157.386.678.401 |
| 2004 | US$ 190.464.790.633 | US$ 29.303.891.020 |
| 2003 | US$ 184.024.332.193 | US$ 24.537.673.815 |
| 2002 | US$ 157.762.914.914 | US$ 22.185.731.358 |
| 2001 | US$ 130.076.677.028 | US$ 18.866.525.322 |
| 2000 | US$ 128.399.516.603 | US$ 20.846.854.711 |
| 1999 | US$ 136.450.101.867 | US$ 18.330.921.206 |
| 1998 | US$ 146.006.089.507 | US$ 15.542.900.630 |
| 1997 | US$ 134.836.033.327 | US$ 16.210.181.642 |
| 1996 | US$ 160.660.160.546 | US$ 16.017.714.791 |
| 1995 | US$ 175.995.426.883 | US$ 10.399.125.055 |
| 1994 | US$ 163.590.579.765 | US$ 9.138.918.507 |
| 1993 | US$ 164.620.171.357 | US$ 9.223.544.328 |
| 1992 | US$ 147.525.874.735 | US$ 7.466.618.403 |
| 1991 | US$ 159.272.850.288 | US$ 13.298.434.204 |
| 1990 | US$ 173.093.564.608 | US$ 13.437.132.419 |
| 1989 | US$ 168.583.563.269 | US$ 18.590.557.937 |
| 1988 | US$ 144.176.820.284 | US$ 22.438.214.643 |
| 1987 | US$ 161.738.455.238 | US$ 24.909.304.908 |
| 1986 | US$ 139.883.920.728 | US$ 20.120.464.282 |
| 1985 | US$ 117.981.972.232 | US$ 26.506.763.265 |
| 1984 | US$ 104.855.936.881 | US$ 26.165.371.829 |
| 1983 | US$ 123.110.064.423 | US$ 29.040.756.673 |
| 1982 | US$ 143.444.661.762 | US$ 31.649.049.103 |
| 1981 | US$ 123.907.234.986 | US$ 34.051.190.080 |
| 1980 | US$ 171.412.607.203 | US$ 26.128.874.848 |
| 1979 | US$ 143.259.225.733 | US$ 21.611.589.271 |
| 1978 | US$ 69.447.964.988 | US$ 20.225.550.057 |
| 1977 | US$ 53.374.370.833 | US$ 30.410.993.714 |
| 1976 | US$ 44.162.131.646 | US$ 27.314.909.464 |
| 1975 | US$ 43.154.974.089 | US$ 23.625.313.525 |
| 1974 | US$ 55.700.252.549 | US$ 14.727.449.735 |
| 1973 | US$ 33.703.588.954 | US$ 4.093.816.070 |
| 1972 | US$ 20.573.775.352 | US$ 2.583.652.933 |
| 1971 | US$ 14.831.073.226 | US$ 1.462.013.713 |
| 1970 | US$ 15.236.515.800 | US$ 669.558.000 |
| 1969 | US$ 17.031.416.000 | US$ 607.180.000 |
| 1968 | US$ 17.857.180.000 | US$ 684.960.000 |
| 1967 | US$ 14.898.992.000 | US$ 761.879.200 |
| 1966 | US$ 14.953.446.600 | US$ 747.859.490 |
| 1965 | US$ 15.498.323.200 | US$ 726.260.320 |
| 1964 | US$ 16.725.493.600 | US$ 585.032.480 |
| 1963 | US$ 16.878.648.000 | US$ 513.943.320 |
| 1962 | US$ 17.252.463.900 | US$ 267.921.030 |
| 1961 | US$ 18.825.530.000 | US$ 238.033.550 |
| 1960 | US$ 19.664.164.000 | US$ 185.058.400 |
Em 2025, as reservas internacionais dos Estados Unidos foram de US$ 1,39 trilhão e as da Arábia Saudita, de US$ 505 bilhões: as dos Estados Unidos foram 2,7 vezes maiores. Em 1960, as reservas dos Estados Unidos foram 110 vezes maiores: US$ 19,7 bilhões dos Estados Unidos e US$ 185 milhões da Arábia Saudita.
As reservas internacionais dos Estados Unidos têm sido maiores que as da Arábia Saudita todos os anos desde 2019.
Estados Unidos vs Arábia Saudita: reservas, incluindo ouro, e meses de importações cobertos
|
Estados Unidos
|
Arábia Saudita
|
|
|---|---|---|
| Reservas, incluindo ouro | US$ 1,39 tri | US$ 505 bi |
| Meses de importações | 3,8 | 16,9 |
| Posição mundial | 2/168 | 8/168 |
| Diferença das reservas | 2,7× | 0,36× |
Comparar as reservas internacionais de 2 países quaisquer
Fontes:
- Banco Mundial | Economy & Growth (1960–2025, atualizado em outubro de 2026)
Creative Commons Atribuição (CC BY): você pode copiar, compartilhar, adaptar e reutilizar este conteúdo, inclusive para fins comerciais, desde que cite o statistics.wiki e indique as alterações que fizer. As fontes listadas acima podem ter suas próprias condições de licença.