
Arábia Saudita vs Egito: reservas internacionais (incluindo ouro) por ano, 1960–2025
1x
| Ano | US$ | |
|---|---|---|
 Arábia Saudita |
 Egito |
|
| 2025 | US$ 505.163.993.095 | US$ 48.875.494.539 |
| 2024 | US$ 463.869.589.071 | US$ 44.921.341.018 |
| 2023 | US$ 457.948.635.287 | US$ 33.070.180.836 |
| 2022 | US$ 478.231.707.666 | US$ 32.143.926.008 |
| 2021 | US$ 473.889.603.513 | US$ 39.824.388.217 |
| 2020 | US$ 472.850.970.845 | US$ 38.972.812.937 |
| 2019 | US$ 514.962.537.825 | US$ 44.568.837.112 |
| 2018 | US$ 509.468.527.336 | US$ 41.839.242.991 |
| 2017 | US$ 509.457.096.430 | US$ 36.400.242.556 |
| 2016 | US$ 547.266.635.919 | US$ 23.642.691.706 |
| 2015 | US$ 626.989.686.478 | US$ 15.858.887.326 |
| 2014 | US$ 744.440.513.643 | US$ 14.926.998.052 |
| 2013 | US$ 737.796.355.078 | US$ 16.536.236.826 |
| 2012 | US$ 673.739.616.018 | US$ 15.672.467.971 |
| 2011 | US$ 556.570.950.256 | US$ 18.637.541.110 |
| 2010 | US$ 459.313.194.915 | US$ 37.028.506.135 |
| 2009 | US$ 420.983.696.036 | US$ 34.896.678.266 |
| 2008 | US$ 451.278.977.578 | US$ 34.330.505.048 |
| 2007 | US$ 309.287.347.097 | US$ 32.214.421.786 |
| 2006 | US$ 228.956.885.016 | US$ 26.006.845.068 |
| 2005 | US$ 157.386.678.401 | US$ 21.856.784.929 |
| 2004 | US$ 29.303.891.020 | US$ 15.338.514.717 |
| 2003 | US$ 24.537.673.815 | US$ 14.603.576.021 |
| 2002 | US$ 22.185.731.358 | US$ 14.076.054.423 |
| 2001 | US$ 18.866.525.322 | US$ 13.598.234.040 |
| 2000 | US$ 20.846.854.711 | US$ 13.785.040.868 |
| 1999 | US$ 18.330.921.206 | US$ 15.190.021.677 |
| 1998 | US$ 15.542.900.630 | US$ 18.823.907.998 |
| 1997 | US$ 16.210.181.642 | US$ 19.370.588.198 |
| 1996 | US$ 16.017.714.791 | US$ 18.296.476.061 |
| 1995 | US$ 10.399.125.055 | US$ 17.121.798.674 |
| 1994 | US$ 9.138.918.507 | US$ 14.412.967.685 |
| 1993 | US$ 9.223.544.328 | US$ 13.854.276.439 |
| 1992 | US$ 7.466.618.403 | US$ 11.620.220.748 |
| 1991 | US$ 13.298.434.204 | US$ 6.185.285.501 |
| 1990 | US$ 13.437.132.419 | US$ 3.619.931.743 |
| 1989 | US$ 18.590.557.937 | US$ 2.495.363.416 |
| 1988 | US$ 22.438.214.643 | US$ 2.261.158.623 |
| 1987 | US$ 24.909.304.908 | US$ 2.555.643.305 |
| 1986 | US$ 20.120.464.282 | US$ 1.779.681.032 |
| 1985 | US$ 26.506.763.265 | US$ 1.587.362.858 |
| 1984 | US$ 26.165.371.829 | US$ 1.485.991.444 |
| 1983 | US$ 29.040.756.673 | US$ 1.698.907.670 |
| 1982 | US$ 31.649.049.103 | US$ 1.809.313.173 |
| 1981 | US$ 34.051.190.080 | US$ 1.682.922.621 |
| 1980 | US$ 26.128.874.848 | US$ 2.479.664.000 |
| 1979 | US$ 21.611.589.271 | US$ 1.795.125.066 |
| 1978 | US$ 20.225.550.057 | US$ 1.050.567.898 |
| 1977 | US$ 30.410.993.714 | US$ 831.886.353 |
| 1976 | US$ 27.314.909.464 | US$ 567.297.180 |
| 1975 | US$ 23.625.313.525 | US$ 535.004.017 |
| 1974 | US$ 14.727.449.735 | US$ 705.412.655 |
| 1973 | US$ 4.093.816.070 | US$ 532.593.785 |
| 1972 | US$ 2.583.652.933 | US$ 209.341.387 |
| 1971 | US$ 1.462.013.713 | US$ 163.240.183 |
| 1970 | US$ 669.558.000 | US$ 165.038.580 |
| 1969 | US$ 607.180.000 | US$ 145.124.800 |
| 1968 | US$ 684.960.000 | US$ 187.040.600 |
| 1967 | US$ 761.879.200 | US$ 196.019.200 |
| 1966 | US$ 747.859.490 | US$ 156.816.540 |
| 1965 | US$ 726.260.320 | US$ 193.777.600 |
| 1964 | US$ 585.032.480 | US$ 223.742.480 |
| 1963 | US$ 513.943.320 | US$ 216.277.440 |
| 1962 | US$ 267.921.030 | US$ 223.227.760 |
| 1961 | US$ 238.033.550 | US$ 203.625.200 |
| 1960 | US$ 185.058.400 | US$ 266.967.600 |
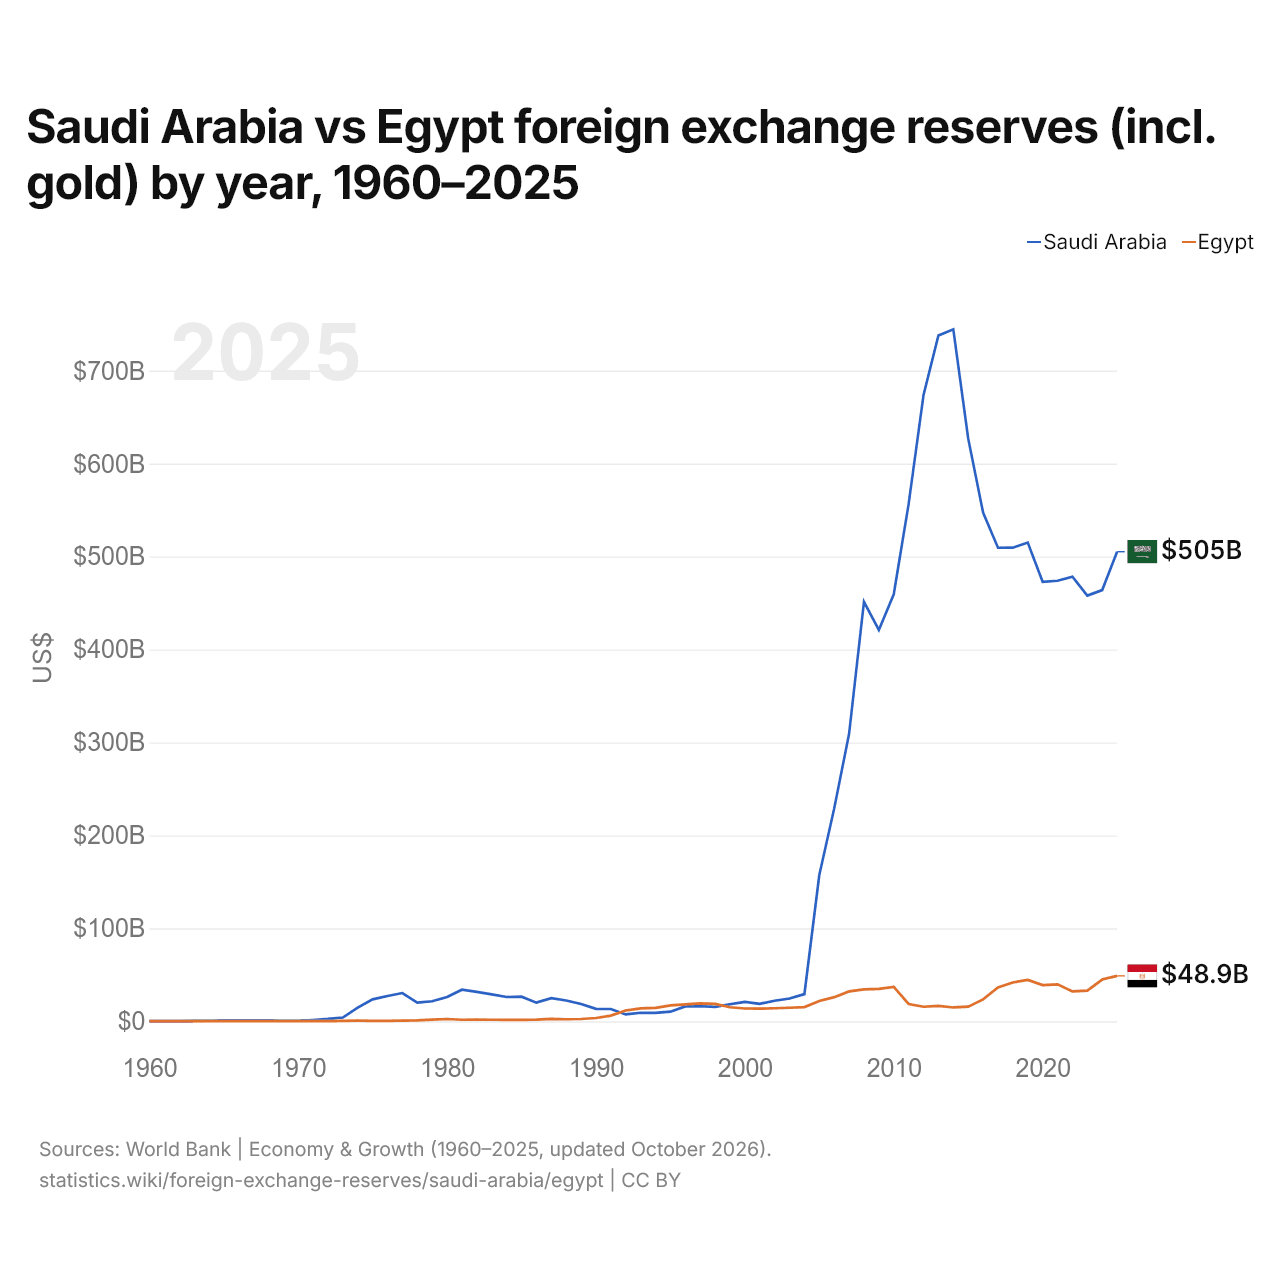
Em 2025, as reservas internacionais da Arábia Saudita foram de US$ 505 bilhões e as do Egito, de US$ 48,9 bilhões: as da Arábia Saudita foram 10 vezes maiores. Em 1960, as reservas do Egito foram 44% maiores: US$ 185 milhões da Arábia Saudita e US$ 267 milhões do Egito.
As reservas internacionais da Arábia Saudita têm sido maiores que as do Egito todos os anos desde 1999.
Arábia Saudita vs Egito: reservas, incluindo ouro, e meses de importações cobertos
|
Arábia Saudita
|
Egito
|
|
|---|---|---|
| Reservas, incluindo ouro | US$ 505 bi | US$ 48,9 bi |
| Meses de importações | 16,9 | 5,1 |
| Posição mundial | 8/168 | 50/168 |
| Diferença das reservas | 10× | 0,097× |
Comparar as reservas internacionais de 2 países quaisquer
Fontes:
- Banco Mundial | Economy & Growth (1960–2025, atualizado em outubro de 2026)
Creative Commons Atribuição (CC BY): você pode copiar, compartilhar, adaptar e reutilizar este conteúdo, inclusive para fins comerciais, desde que cite o statistics.wiki e indique as alterações que fizer. As fontes listadas acima podem ter suas próprias condições de licença.