
Líbano vs Israel: investimento estrangeiro direto, entradas líquidas por ano (US$), 1970–2025
1x
| Ano | US$ | |
|---|---|---|
 Líbano |
 Israel |
|
| 2025 | US$ 2.041.796.982 | US$ 26.242.100.000 |
| 2024 | US$ 1.764.118.831 | US$ 14.777.900.000 |
| 2023 | US$ 655.437.382 | US$ 16.170.300.000 |
| 2022 | US$ 526.838.754 | US$ 22.883.500.000 |
| 2021 | US$ 599.788.271 | US$ 18.949.900.000 |
| 2020 | US$ 1.606.894.722 | US$ 20.968.700.000 |
| 2019 | US$ 1.906.392.482 | US$ 17.362.500.000 |
| 2018 | US$ 2.658.003.845 | US$ 21.514.500.000 |
| 2017 | US$ 2.522.409.653 | US$ 16.892.500.000 |
| 2016 | US$ 2.568.485.071 | US$ 11.988.000.000 |
| 2015 | US$ 2.159.289.952 | US$ 11.336.200.000 |
| 2014 | US$ 2.862.509.427 | US$ 6.048.900.000 |
| 2013 | US$ 2.661.087.128 | US$ 11.842.200.000 |
| 2012 | US$ 3.111.315.000 | US$ 9.017.300.000 |
| 2011 | US$ 3.137.050.288 | US$ 8.653.000.000 |
| 2010 | US$ 4.279.880.835 | US$ 6.984.700.000 |
| 2009 | US$ 4.803.602.660 | US$ 4.606.900.000 |
| 2008 | US$ 4.333.045.470 | US$ 10.274.200.000 |
| 2007 | US$ 3.375.980.758 | US$ 8.798.100.000 |
| 2006 | US$ 2.674.534.372 | US$ 14.395.500.000 |
| 2005 | US$ 2.623.502.612 | US$ 4.818.400.000 |
| 2004 | US$ 1.898.780.570 | US$ 2.946.900.000 |
| 2003 | US$ 2.860.020.313 | US$ 3.322.000.000 |
| 2002 | US$ 1.335.970.000 | US$ 1.582.500.000 |
| 2001 | US$ 1.453.907.497 | US$ 1.771.300.000 |
| 2000 | US$ 993.475.429 | US$ 8.047.500.000 |
| 1999 | US$ 871.676.542 | US$ 4.150.000.000 |
| 1998 | US$ 1.134.903.121 | US$ 1.737.400.000 |
| 1997 | US$ 1.799.600.000 | US$ 1.633.800.000 |
| 1996 | US$ 80.000.000 | US$ 1.397.100.000 |
| 1995 | US$ 35.000.000 | US$ 1.350.300.000 |
| 1994 | US$ 22.560.000 | US$ 441.600.000 |
| 1993 | US$ 7.400.000 | US$ 604.900.000 |
| 1992 | US$ 18.460.000 | US$ 588.500.000 |
| 1991 | US$ 1.630.000 | US$ 345.600.000 |
| 1990 | US$ 6.450.000 | US$ 151.000.000 |
| 1989 | US$ 1.590.000 | US$ 160.400.000 |
| 1988 | US$ −270.000 | US$ 267.200.000 |
| 1987 | US$ 1.250.000 | US$ 224.100.000 |
| 1986 | US$ 10.480.000 | US$ 143.400.000 |
| 1985 | US$ 6.930.000 | US$ 112.300.000 |
| 1984 | US$ 5.070.000 | US$ 89.500.000 |
| 1983 | US$ 600.000 | US$ 78.500.000 |
| 1982 | US$ −670.000 | US$ 21.300.000 |
| 1981 | US$ 1.660.000 | US$ 114.400.000 |
| 1980 | US$ −12.160.000 | US$ 51.000.000 |
| 1979 | US$ 290.000 | US$ 11.000.000 |
| 1978 | US$ 2.230.000 | US$ 39.000.000 |
| 1977 | US$ 6.100.000 | US$ 81.000.000 |
| 1976 | US$ 7.490.000 | US$ 47.000.000 |
| 1975 | US$ 5.040.000 | US$ 45.000.000 |
| 1974 | US$ 6.340.000 | US$ 84.000.000 |
| 1973 | US$ 3.950.000 | US$ 149.000.000 |
| 1972 | US$ 760.000 | US$ 114.000.000 |
| 1971 | US$ −80.000 | US$ 57.000.000 |
| 1970 | - | US$ 49.000.000 |
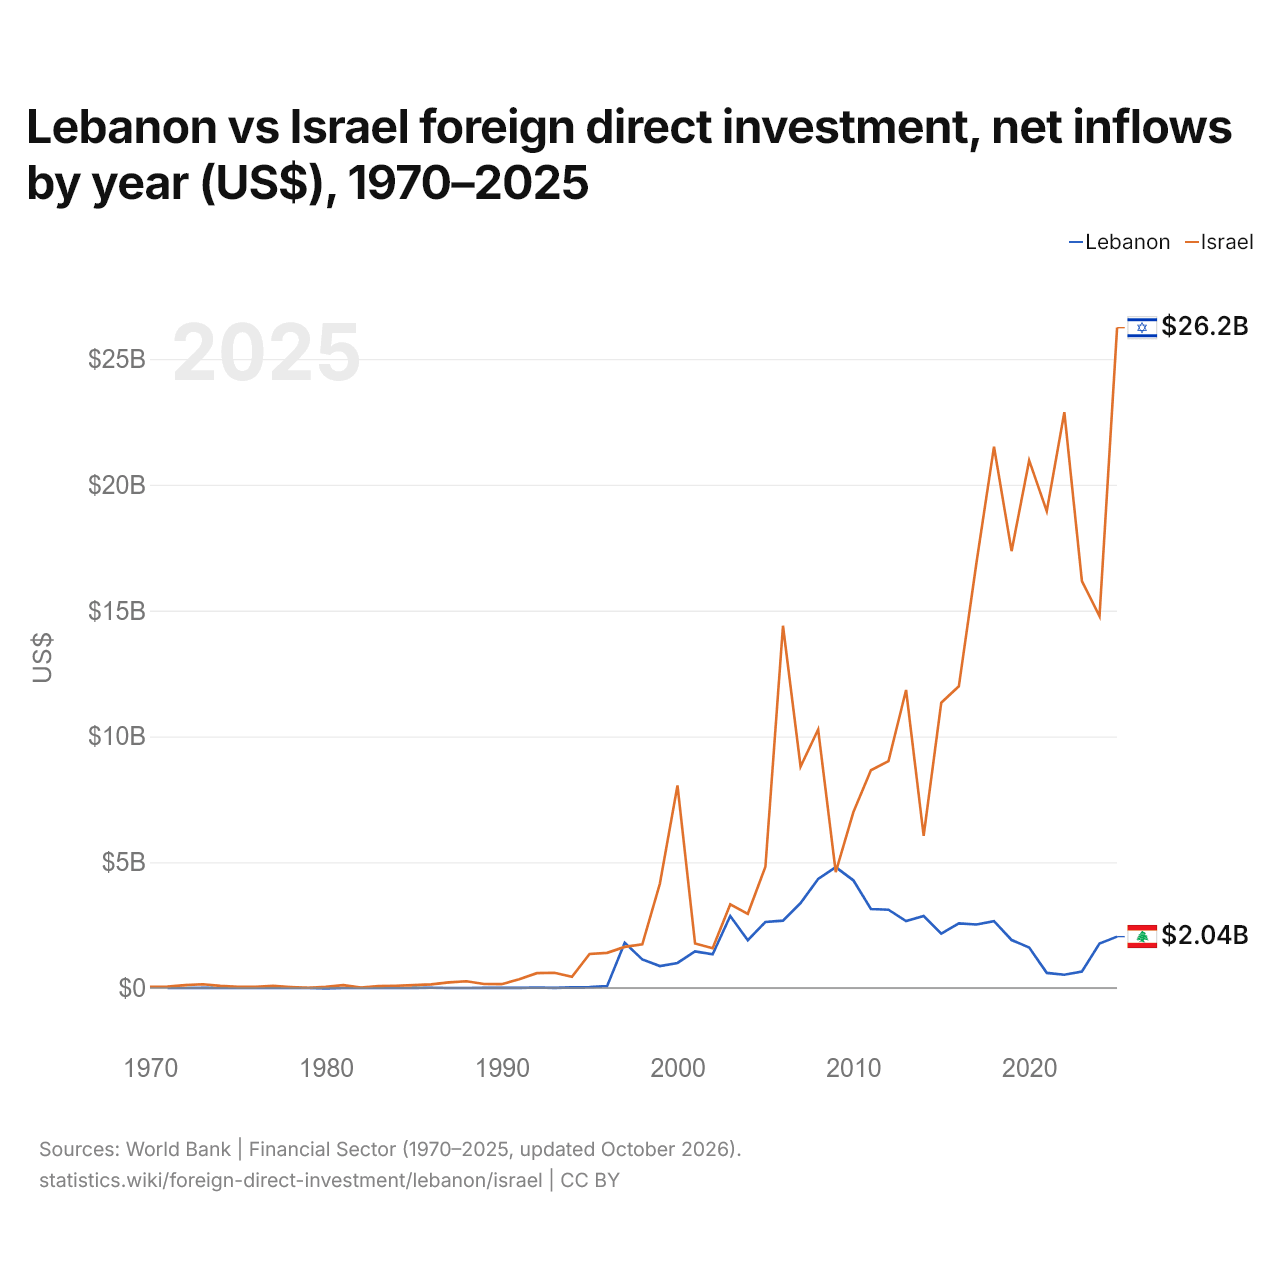
Em 2025, as entradas líquidas de investimento estrangeiro direto foram de US$ 2,04 bilhões no Líbano e de US$ 26,2 bilhões em Israel: 13 vezes mais em Israel. Em 1971, foram negativas no Líbano, de US$ 80.000 e de US$ 57 milhões em Israel.
As entradas líquidas de investimento estrangeiro direto no Líbano foram maiores que em Israel em 2 dos 55 anos de 1971 a 2025, e menores em 53.
Líbano vs Israel: entradas e saídas mais recentes de investimento estrangeiro
|
Líbano
|
Israel
|
|
|---|---|---|
| Entradas líquidas | +US$ 2,04 bi | +US$ 26,2 bi |
| Entradas líquidas, % do PIB | n/d | +4,3% |
| Saídas líquidas | +US$ 265 mi | +US$ 14,7 bi |
| Entradas líquidas, total 2016–2025 | +US$ 16,9 bi | +US$ 188 bi |
| Posição mundial | 64/192 | 18/192 |
Comparar o investimento estrangeiro direto de 2 países quaisquer
Fontes:
- Banco Mundial | Financial Sector (1970–2025, atualizado em outubro de 2026)
Creative Commons Atribuição (CC BY): você pode copiar, compartilhar, adaptar e reutilizar este conteúdo, inclusive para fins comerciais, desde que cite o statistics.wiki e indique as alterações que fizer. As fontes listadas acima podem ter suas próprias condições de licença.