
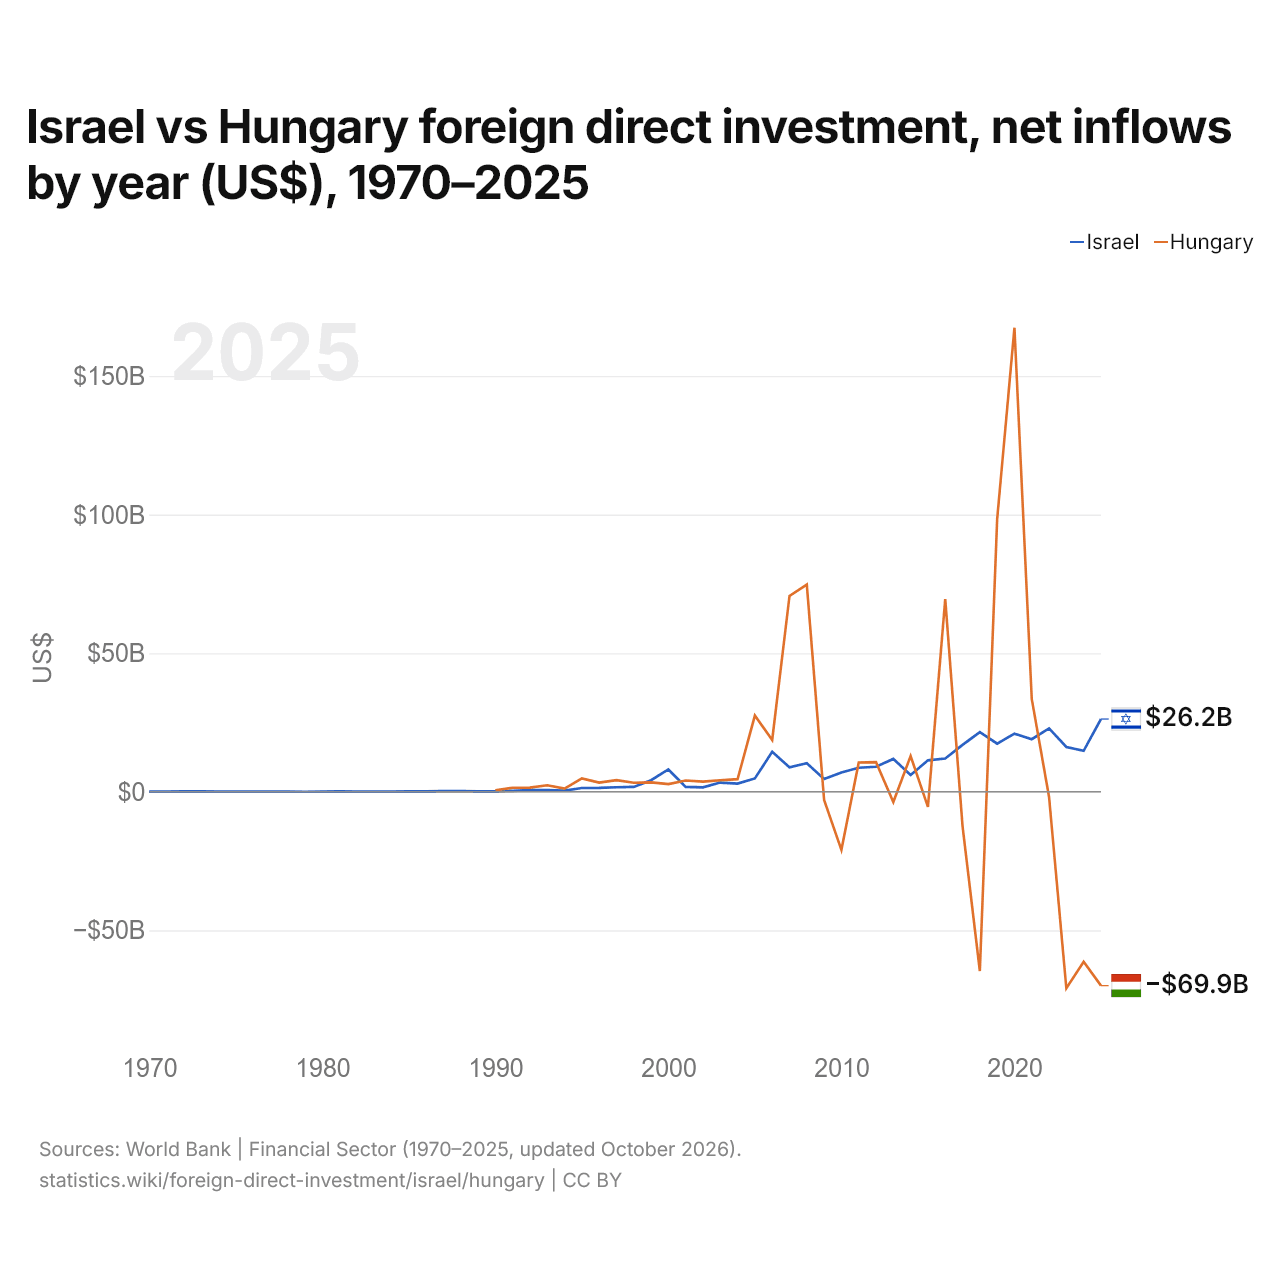
Israel vs Hungria: investimento estrangeiro direto, entradas líquidas por ano (US$), 1970–2025
1x
| Ano | US$ | |
|---|---|---|
 Israel |
 Hungria |
|
| 2025 | US$ 26.242.100.000 | US$ −69.938.246.708 |
| 2024 | US$ 14.777.900.000 | US$ −61.303.476.152 |
| 2023 | US$ 16.170.300.000 | US$ −70.896.108.744 |
| 2022 | US$ 22.883.500.000 | US$ −1.862.893.349 |
| 2021 | US$ 18.949.900.000 | US$ 33.474.586.359 |
| 2020 | US$ 20.968.700.000 | US$ 167.399.384.338 |
| 2019 | US$ 17.362.500.000 | US$ 98.265.233.190 |
| 2018 | US$ 21.514.500.000 | US$ −64.648.352.414 |
| 2017 | US$ 16.892.500.000 | US$ −12.371.761.180 |
| 2016 | US$ 11.988.000.000 | US$ 69.453.473.203 |
| 2015 | US$ 11.336.200.000 | US$ −5.469.731.522 |
| 2014 | US$ 6.048.900.000 | US$ 12.880.113.630 |
| 2013 | US$ 11.842.200.000 | US$ −3.730.081.936 |
| 2012 | US$ 9.017.300.000 | US$ 10.670.096.332 |
| 2011 | US$ 8.653.000.000 | US$ 10.563.869.737 |
| 2010 | US$ 6.984.700.000 | US$ −20.952.692.165 |
| 2009 | US$ 4.606.900.000 | US$ −2.986.078.748 |
| 2008 | US$ 10.274.200.000 | US$ 74.741.370.129 |
| 2007 | US$ 8.798.100.000 | US$ 70.631.297.039 |
| 2006 | US$ 14.395.500.000 | US$ 18.678.720.025 |
| 2005 | US$ 4.818.400.000 | US$ 27.489.690.204 |
| 2004 | US$ 2.946.900.000 | US$ 4.538.099.567 |
| 2003 | US$ 3.322.000.000 | US$ 4.157.510.420 |
| 2002 | US$ 1.582.500.000 | US$ 3.643.428.380 |
| 2001 | US$ 1.771.300.000 | US$ 4.058.819.561 |
| 2000 | US$ 8.047.500.000 | US$ 2.747.712.560 |
| 1999 | US$ 4.150.000.000 | US$ 3.384.965.975 |
| 1998 | US$ 1.737.400.000 | US$ 3.261.654.750 |
| 1997 | US$ 1.633.800.000 | US$ 4.164.123.320 |
| 1996 | US$ 1.397.100.000 | US$ 3.288.936.449 |
| 1995 | US$ 1.350.300.000 | US$ 4.804.151.332 |
| 1994 | US$ 441.600.000 | US$ 1.144.083.870 |
| 1993 | US$ 604.900.000 | US$ 2.349.715.111 |
| 1992 | US$ 588.500.000 | US$ 1.479.165.394 |
| 1991 | US$ 345.600.000 | US$ 1.462.141.210 |
| 1990 | US$ 151.000.000 | US$ 553.809.000 |
| 1989 | US$ 160.400.000 | - |
| 1988 | US$ 267.200.000 | - |
| 1987 | US$ 224.100.000 | - |
| 1986 | US$ 143.400.000 | - |
| 1985 | US$ 112.300.000 | - |
| 1984 | US$ 89.500.000 | - |
| 1983 | US$ 78.500.000 | - |
| 1982 | US$ 21.300.000 | - |
| 1981 | US$ 114.400.000 | - |
| 1980 | US$ 51.000.000 | - |
| 1979 | US$ 11.000.000 | - |
| 1978 | US$ 39.000.000 | - |
| 1977 | US$ 81.000.000 | - |
| 1976 | US$ 47.000.000 | - |
| 1975 | US$ 45.000.000 | - |
| 1974 | US$ 84.000.000 | - |
| 1973 | US$ 149.000.000 | - |
| 1972 | US$ 114.000.000 | - |
| 1971 | US$ 57.000.000 | - |
| 1970 | US$ 49.000.000 | - |
Em 2025, as entradas líquidas de investimento estrangeiro direto foram de US$ 26,2 bilhões em Israel e negativas na Hungria, de US$ 69,9 bilhões. Em 1990, foram de US$ 151 milhões em Israel e de US$ 554 milhões na Hungria.
As entradas líquidas de investimento estrangeiro direto em Israel foram maiores que na Hungria em 12 dos 36 anos de 1990 a 2025, e menores em 24.
Israel vs Hungria: entradas e saídas mais recentes de investimento estrangeiro
|
Israel
|
Hungria
|
|
|---|---|---|
| Entradas líquidas | +US$ 26,2 bi | -US$ 69,9 bi |
| Entradas líquidas, % do PIB | +4,3% | −28,4% |
| Saídas líquidas | +US$ 14,7 bi | -US$ 60,8 bi |
| Entradas líquidas, total 2016–2025 | +US$ 188 bi | +US$ 87,6 bi |
| Posição mundial | 18/192 | 192/192 |
Comparar o investimento estrangeiro direto de 2 países quaisquer
Fontes:
- Banco Mundial | Financial Sector (1970–2025, atualizado em outubro de 2026)
Creative Commons Atribuição (CC BY): você pode copiar, compartilhar, adaptar e reutilizar este conteúdo, inclusive para fins comerciais, desde que cite o statistics.wiki e indique as alterações que fizer. As fontes listadas acima podem ter suas próprias condições de licença.