
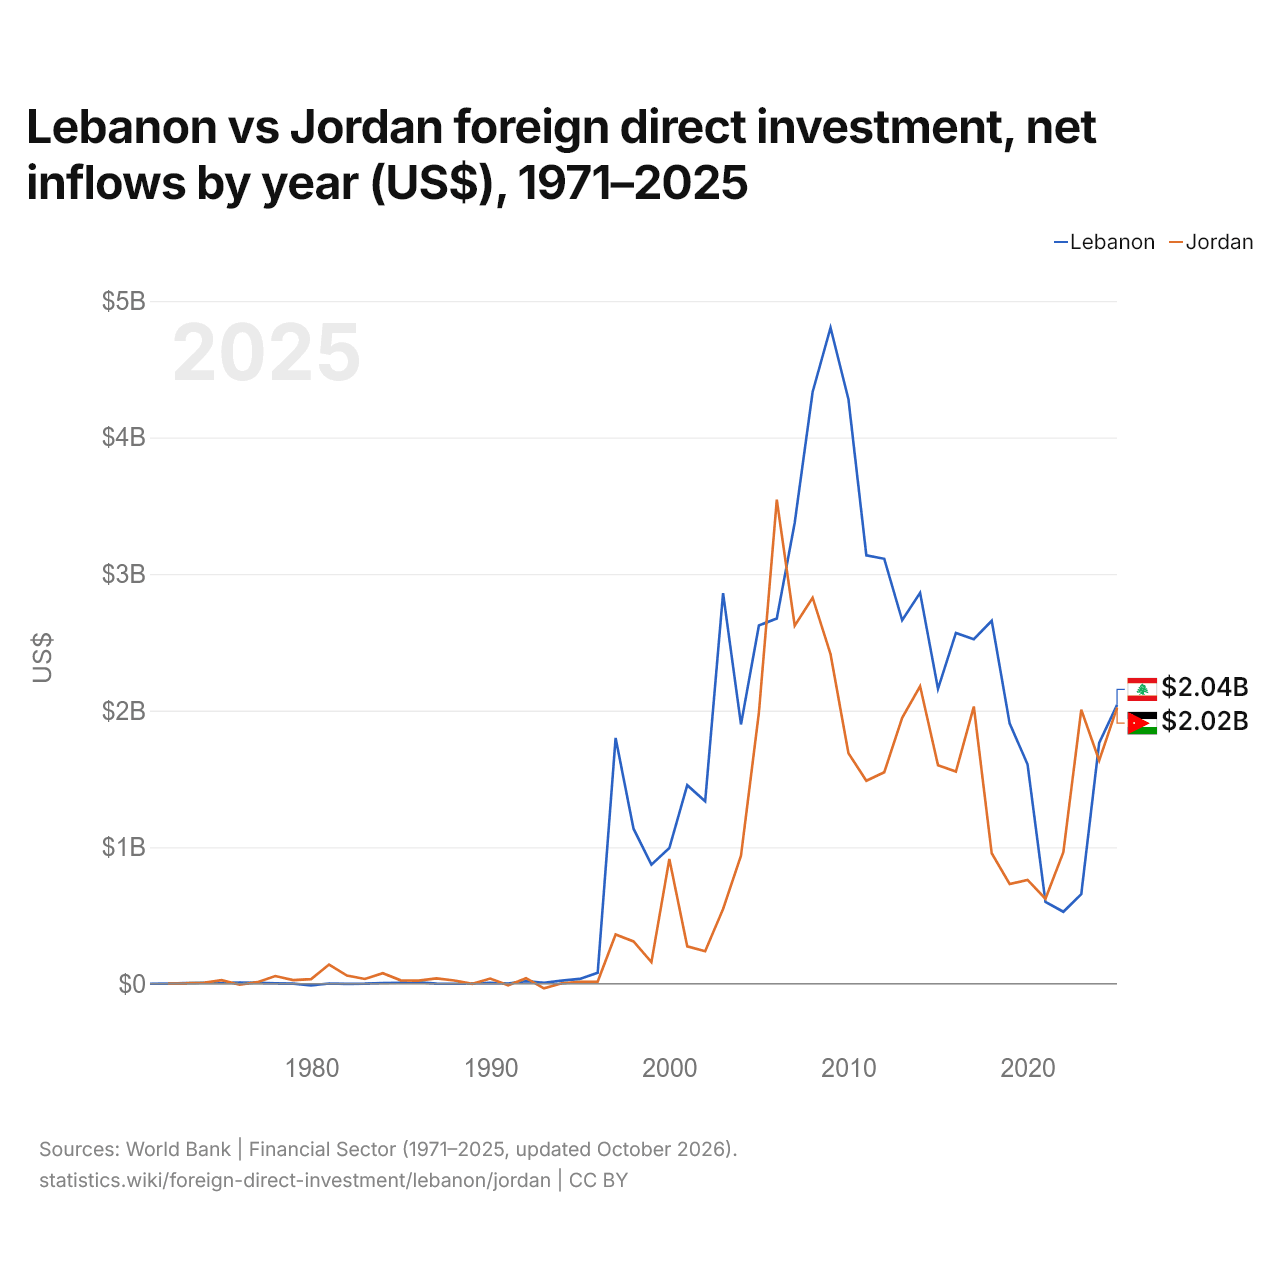
Líbano vs Jordânia: investimento estrangeiro direto, entradas líquidas por ano (US$), 1971–2025
1x
| Ano | US$ | |
|---|---|---|
 Líbano |
 Jordânia |
|
| 2025 | US$ 2.041.796.982 | US$ 2.021.971.831 |
| 2024 | US$ 1.764.118.831 | US$ 1.634.647.887 |
| 2023 | US$ 655.437.382 | US$ 2.006.338.028 |
| 2022 | US$ 526.838.754 | US$ 962.535.211 |
| 2021 | US$ 599.788.271 | US$ 621.830.986 |
| 2020 | US$ 1.606.894.722 | US$ 760.281.690 |
| 2019 | US$ 1.906.392.482 | US$ 729.718.310 |
| 2018 | US$ 2.658.003.845 | US$ 954.929.577 |
| 2017 | US$ 2.522.409.653 | US$ 2.029.718.310 |
| 2016 | US$ 2.568.485.071 | US$ 1.552.957.746 |
| 2015 | US$ 2.159.289.952 | US$ 1.600.281.690 |
| 2014 | US$ 2.862.509.427 | US$ 2.178.450.704 |
| 2013 | US$ 2.661.087.128 | US$ 1.946.597.204 |
| 2012 | US$ 3.111.315.000 | US$ 1.548.450.704 |
| 2011 | US$ 3.137.050.288 | US$ 1.486.056.338 |
| 2010 | US$ 4.279.880.835 | US$ 1.688.394.366 |
| 2009 | US$ 4.803.602.660 | US$ 2.413.098.592 |
| 2008 | US$ 4.333.045.470 | US$ 2.826.744.496 |
| 2007 | US$ 3.375.980.758 | US$ 2.622.144.779 |
| 2006 | US$ 2.674.534.372 | US$ 3.544.005.642 |
| 2005 | US$ 2.623.502.612 | US$ 1.984.485.190 |
| 2004 | US$ 1.898.780.570 | US$ 936.812.412 |
| 2003 | US$ 2.860.020.313 | US$ 546.967.560 |
| 2002 | US$ 1.335.970.000 | US$ 238.222.875 |
| 2001 | US$ 1.453.907.497 | US$ 273.628.171 |
| 2000 | US$ 993.475.429 | US$ 913.258.110 |
| 1999 | US$ 871.676.542 | US$ 157.968.970 |
| 1998 | US$ 1.134.903.121 | US$ 310.014.104 |
| 1997 | US$ 1.799.600.000 | US$ 360.930.889 |
| 1996 | US$ 80.000.000 | US$ 15.514.810 |
| 1995 | US$ 35.000.000 | US$ 13.308.089 |
| 1994 | US$ 22.560.000 | US$ 2.854.732 |
| 1993 | US$ 7.400.000 | US$ −33.548.530 |
| 1992 | US$ 18.460.000 | US$ 40.722.567 |
| 1991 | US$ 1.630.000 | US$ −11.887.398 |
| 1990 | US$ 6.450.000 | US$ 37.646.775 |
| 1989 | US$ 1.590.000 | US$ −1.349.805 |
| 1988 | US$ −270.000 | US$ 23.731.746 |
| 1987 | US$ 1.250.000 | US$ 39.498.588 |
| 1986 | US$ 10.480.000 | US$ 22.754.208 |
| 1985 | US$ 6.930.000 | US$ 24.948.927 |
| 1984 | US$ 5.070.000 | US$ 77.487.833 |
| 1983 | US$ 600.000 | US$ 34.864.662 |
| 1982 | US$ −670.000 | US$ 59.432.046 |
| 1981 | US$ 1.660.000 | US$ 140.813.772 |
| 1980 | US$ −12.160.000 | US$ 33.830.643 |
| 1979 | US$ 290.000 | US$ 26.371.066 |
| 1978 | US$ 2.230.000 | US$ 56.431.307 |
| 1977 | US$ 6.100.000 | US$ 11.230.237 |
| 1976 | US$ 7.490.000 | US$ −7.530.499 |
| 1975 | US$ 5.040.000 | US$ 25.641.694 |
| 1974 | US$ 6.340.000 | US$ 6.830.354 |
| 1973 | US$ 3.950.000 | US$ 2.130.438 |
| 1972 | US$ 760.000 | US$ 559.999 |
| 1971 | US$ −80.000 | - |
Em 2025, as entradas líquidas de investimento estrangeiro direto foram de US$ 2,04 bilhões no Líbano e de US$ 2,02 bilhões na Jordânia: 0,98% a mais no Líbano. Em 1972, foram de US$ 760.000 no Líbano e de US$ 560.000 na Jordânia.
As entradas líquidas de investimento estrangeiro direto no Líbano foram maiores que na Jordânia em 34 dos 54 anos de 1972 a 2025, e menores em 20.
Líbano vs Jordânia: entradas e saídas mais recentes de investimento estrangeiro
|
Líbano
|
Jordânia
|
|
|---|---|---|
| Entradas líquidas | +US$ 2,04 bi | +US$ 2,02 bi |
| Entradas líquidas, % do PIB | n/d | +3,3% |
| Saídas líquidas | +US$ 265 mi | +US$ 97,9 mi |
| Entradas líquidas, total 2016–2025 | +US$ 16,9 bi | +US$ 13,3 bi |
| Posição mundial | 64/192 | 66/192 |
Comparar o investimento estrangeiro direto de 2 países quaisquer
Fontes:
- Banco Mundial | Financial Sector (1971–2025, atualizado em outubro de 2026)
Creative Commons Atribuição (CC BY): você pode copiar, compartilhar, adaptar e reutilizar este conteúdo, inclusive para fins comerciais, desde que cite o statistics.wiki e indique as alterações que fizer. As fontes listadas acima podem ter suas próprias condições de licença.