
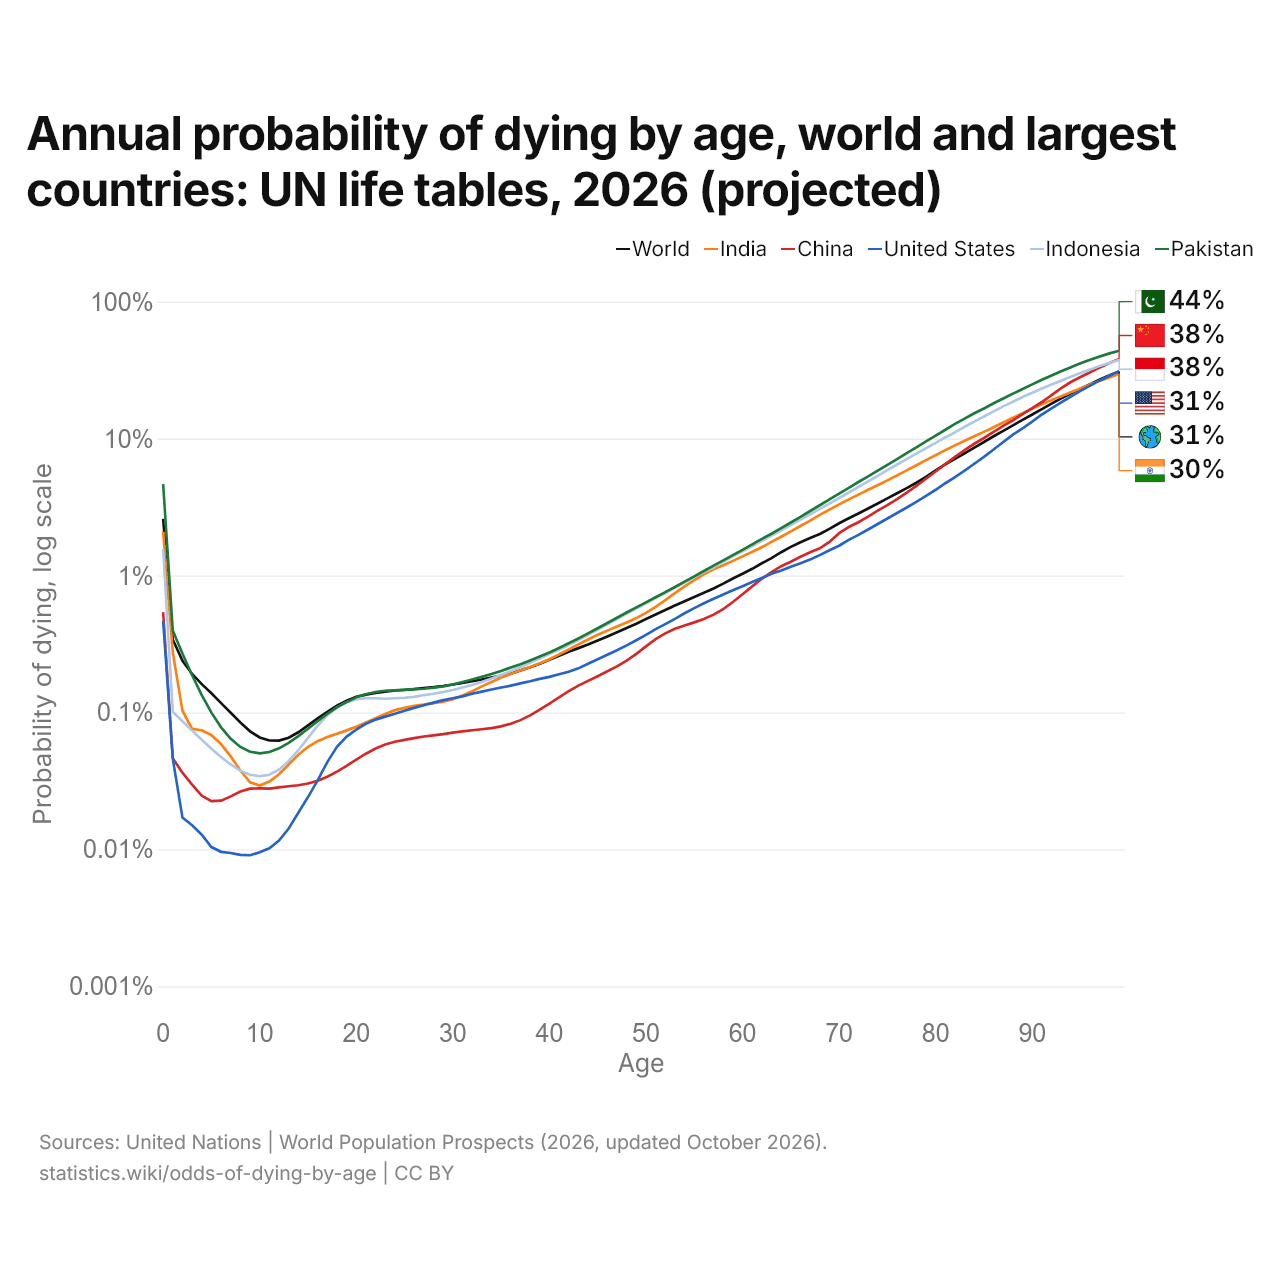
Annual probability of dying by age, world and largest countries: UN life tables, 2026 (projected)
| Age | Probability of dying, log scale | |||||
|---|---|---|---|---|---|---|
| World | India | China | United States | Indonesia | Pakistan | |
| 0 | 2.59% | 2.09% | 0.54% | 0.466% | 1.56% | 4.65% |
| 1 | 0.341% | 0.275% | 0.046% | 0.046% | 0.101% | 0.397% |
| 2 | 0.238% | 0.103% | 0.036% | 0.017% | 0.086% | 0.269% |
| 3 | 0.191% | 0.076% | 0.03% | 0.015% | 0.074% | 0.187% |
| 4 | 0.161% | 0.074% | 0.025% | 0.013% | 0.063% | 0.134% |
| 5 | 0.138% | 0.068% | 0.022% | 0.01% | 0.054% | 0.1% |
| 6 | 0.117% | 0.059% | 0.023% | 0.01% | 0.047% | 0.078% |
| 7 | 0.1% | 0.048% | 0.024% | 0.009% | 0.042% | 0.064% |
| 8 | 0.084% | 0.038% | 0.026% | 0.009% | 0.038% | 0.056% |
| 9 | 0.073% | 0.031% | 0.028% | 0.009% | 0.035% | 0.052% |
| 10 | 0.066% | 0.029% | 0.028% | 0.01% | 0.034% | 0.05% |
| 11 | 0.062% | 0.031% | 0.028% | 0.01% | 0.035% | 0.051% |
| 12 | 0.062% | 0.035% | 0.028% | 0.012% | 0.038% | 0.055% |
| 13 | 0.065% | 0.042% | 0.029% | 0.014% | 0.044% | 0.06% |
| 14 | 0.072% | 0.049% | 0.029% | 0.018% | 0.053% | 0.067% |
| 15 | 0.081% | 0.056% | 0.03% | 0.024% | 0.065% | 0.076% |
| 16 | 0.091% | 0.062% | 0.032% | 0.032% | 0.08% | 0.086% |
| 17 | 0.101% | 0.066% | 0.034% | 0.043% | 0.096% | 0.098% |
| 18 | 0.112% | 0.07% | 0.037% | 0.056% | 0.109% | 0.109% |
| 19 | 0.122% | 0.074% | 0.041% | 0.067% | 0.119% | 0.119% |
| 20 | 0.13% | 0.079% | 0.045% | 0.075% | 0.125% | 0.129% |
| 21 | 0.135% | 0.085% | 0.05% | 0.083% | 0.127% | 0.136% |
| 22 | 0.139% | 0.091% | 0.054% | 0.089% | 0.127% | 0.141% |
| 23 | 0.142% | 0.098% | 0.058% | 0.093% | 0.126% | 0.144% |
| 24 | 0.145% | 0.104% | 0.061% | 0.098% | 0.127% | 0.145% |
| 25 | 0.146% | 0.108% | 0.063% | 0.103% | 0.128% | 0.147% |
| 26 | 0.148% | 0.112% | 0.065% | 0.108% | 0.13% | 0.148% |
| 27 | 0.151% | 0.114% | 0.067% | 0.113% | 0.134% | 0.149% |
| 28 | 0.153% | 0.117% | 0.068% | 0.118% | 0.137% | 0.152% |
| 29 | 0.156% | 0.12% | 0.069% | 0.123% | 0.141% | 0.155% |
| 30 | 0.16% | 0.125% | 0.071% | 0.127% | 0.146% | 0.16% |
| 31 | 0.164% | 0.133% | 0.073% | 0.131% | 0.152% | 0.167% |
| 32 | 0.169% | 0.143% | 0.074% | 0.137% | 0.159% | 0.174% |
| 33 | 0.174% | 0.155% | 0.075% | 0.142% | 0.167% | 0.182% |
| 34 | 0.18% | 0.167% | 0.077% | 0.147% | 0.177% | 0.191% |
| 35 | 0.186% | 0.18% | 0.079% | 0.152% | 0.188% | 0.201% |
| 36 | 0.192% | 0.191% | 0.083% | 0.157% | 0.201% | 0.213% |
| 37 | 0.203% | 0.203% | 0.088% | 0.163% | 0.215% | 0.225% |
| 38 | 0.214% | 0.215% | 0.095% | 0.169% | 0.231% | 0.24% |
| 39 | 0.227% | 0.229% | 0.105% | 0.176% | 0.248% | 0.256% |
| 40 | 0.243% | 0.245% | 0.116% | 0.182% | 0.267% | 0.274% |
| 41 | 0.26% | 0.265% | 0.129% | 0.19% | 0.288% | 0.296% |
| 42 | 0.278% | 0.288% | 0.143% | 0.198% | 0.311% | 0.32% |
| 43 | 0.295% | 0.314% | 0.157% | 0.21% | 0.338% | 0.347% |
| 44 | 0.313% | 0.341% | 0.17% | 0.227% | 0.369% | 0.378% |
| 45 | 0.335% | 0.369% | 0.184% | 0.245% | 0.403% | 0.412% |
| 46 | 0.359% | 0.396% | 0.2% | 0.264% | 0.441% | 0.45% |
| 47 | 0.385% | 0.424% | 0.217% | 0.285% | 0.482% | 0.492% |
| 48 | 0.414% | 0.454% | 0.239% | 0.309% | 0.527% | 0.537% |
| 49 | 0.445% | 0.489% | 0.268% | 0.337% | 0.575% | 0.585% |
| 50 | 0.481% | 0.534% | 0.304% | 0.369% | 0.628% | 0.637% |
| 51 | 0.52% | 0.591% | 0.343% | 0.406% | 0.684% | 0.694% |
| 52 | 0.561% | 0.661% | 0.378% | 0.442% | 0.746% | 0.756% |
| 53 | 0.605% | 0.743% | 0.408% | 0.483% | 0.813% | 0.825% |
| 54 | 0.65% | 0.833% | 0.432% | 0.53% | 0.887% | 0.902% |
| 55 | 0.697% | 0.927% | 0.455% | 0.578% | 0.969% | 0.987% |
| 56 | 0.749% | 1.02% | 0.482% | 0.627% | 1.06% | 1.08% |
| 57 | 0.805% | 1.11% | 0.518% | 0.677% | 1.15% | 1.18% |
| 58 | 0.873% | 1.19% | 0.569% | 0.727% | 1.26% | 1.29% |
| 59 | 0.952% | 1.28% | 0.641% | 0.781% | 1.38% | 1.41% |
| 60 | 1.03% | 1.38% | 0.73% | 0.834% | 1.5% | 1.54% |
| 61 | 1.12% | 1.49% | 0.834% | 0.897% | 1.64% | 1.69% |
| 62 | 1.23% | 1.61% | 0.947% | 0.959% | 1.79% | 1.85% |
| 63 | 1.34% | 1.76% | 1.06% | 1.03% | 1.96% | 2.02% |
| 64 | 1.48% | 1.92% | 1.17% | 1.09% | 2.14% | 2.22% |
| 65 | 1.62% | 2.1% | 1.26% | 1.16% | 2.34% | 2.44% |
| 66 | 1.75% | 2.3% | 1.37% | 1.23% | 2.56% | 2.68% |
| 67 | 1.88% | 2.52% | 1.48% | 1.31% | 2.8% | 2.96% |
| 68 | 2.01% | 2.77% | 1.58% | 1.41% | 3.07% | 3.26% |
| 69 | 2.19% | 3.03% | 1.76% | 1.53% | 3.36% | 3.6% |
| 70 | 2.41% | 3.31% | 2.04% | 1.65% | 3.68% | 3.97% |
| 71 | 2.62% | 3.6% | 2.26% | 1.82% | 4.04% | 4.37% |
| 72 | 2.84% | 3.9% | 2.45% | 1.98% | 4.43% | 4.82% |
| 73 | 3.09% | 4.23% | 2.69% | 2.17% | 4.87% | 5.3% |
| 74 | 3.36% | 4.57% | 2.98% | 2.38% | 5.35% | 5.84% |
| 75 | 3.66% | 4.95% | 3.27% | 2.61% | 5.88% | 6.43% |
| 76 | 3.99% | 5.39% | 3.62% | 2.86% | 6.47% | 7.08% |
| 77 | 4.35% | 5.86% | 4.03% | 3.14% | 7.09% | 7.82% |
| 78 | 4.76% | 6.39% | 4.52% | 3.45% | 7.76% | 8.64% |
| 79 | 5.25% | 6.97% | 5.09% | 3.82% | 8.5% | 9.54% |
| 80 | 5.86% | 7.58% | 5.75% | 4.23% | 9.3% | 10.5% |
| 81 | 6.5% | 8.24% | 6.51% | 4.72% | 10.2% | 11.6% |
| 82 | 7.11% | 8.92% | 7.35% | 5.23% | 11.1% | 12.8% |
| 83 | 7.81% | 9.64% | 8.24% | 5.84% | 12.2% | 14% |
| 84 | 8.6% | 10.4% | 9.17% | 6.55% | 13.3% | 15.3% |
| 85 | 9.44% | 11.2% | 10.1% | 7.36% | 14.5% | 16.6% |
| 86 | 10.4% | 12.1% | 11.2% | 8.32% | 15.8% | 18.1% |
| 87 | 11.4% | 13.1% | 12.4% | 9.44% | 17.2% | 19.6% |
| 88 | 12.5% | 14.2% | 13.6% | 10.7% | 18.6% | 21.3% |
| 89 | 13.7% | 15.3% | 15.1% | 11.9% | 20.1% | 23% |
| 90 | 15% | 16.5% | 16.7% | 13.3% | 21.6% | 24.9% |
| 91 | 16.4% | 17.8% | 18.5% | 15% | 23.2% | 26.9% |
| 92 | 18% | 19.1% | 20.8% | 16.6% | 24.8% | 28.9% |
| 93 | 19.7% | 20.4% | 23.4% | 18.4% | 26.5% | 31% |
| 94 | 21.4% | 21.8% | 25.9% | 20.3% | 28.3% | 33.2% |
| 95 | 23.1% | 23.2% | 28.2% | 22.3% | 30.1% | 35.5% |
| 96 | 25% | 24.8% | 30.5% | 24.4% | 32% | 37.7% |
| 97 | 27% | 26.4% | 33.1% | 26.6% | 33.9% | 39.8% |
| 98 | 29% | 28% | 35.7% | 28.8% | 35.7% | 41.9% |
| 99 | 30.9% | 29.7% | 38.1% | 31.1% | 37.6% | 43.8% |
In 2026, the risk of dying within a year is 2.6% at birth worldwide; it is lowest at the age of 12, at 0.062%, and 5.9% at 80. Among the five most populous countries, the risk at birth is highest in Pakistan, at 4.7%, and lowest in the United States, at 0.47%.
The UN's child mortality estimates (UN IGME) put China lowest in infant mortality, at 4.1 deaths per 1,000 live births, against 5.5 in the United States.
Adult mortality (probability of dying at 15–60) by country: UN life tables, 2026 (projected)
| Rank | Country | Both sexes | Men | Women | Lowest-risk age |
|---|---|---|---|---|---|
 World |
13.1% | 16.1% | 10.0% | 12 | |
| 1 |  Lesotho |
39.5% | 44.9% | 34.2% | 10 |
| 2 |  CAR |
34.6% | 38.3% | 31.7% | 11 |
| 3 |  Nigeria |
34.4% | 35.2% | 33.7% | 13 |
| 4 |  Nauru |
34.0% | 37.8% | 29.8% | 4 |
| 5 |  Chad |
33.9% | 37.4% | 30.4% | 13 |
| 6 |  Kenya |
30.7% | 34.7% | 26.5% | 10 |
| 7 |  Zimbabwe |
30.3% | 35.3% | 26.5% | 10 |
| 8 |  South Sudan |
29.8% | 35.3% | 24.5% | 13 |
| 9 |  South Africa |
28.9% | 34.8% | 22.9% | 9 |
| 10 |  Ivory Coast |
28.7% | 31.3% | 25.7% | 11 |
| 11 |  Eswatini |
28.4% | 34.2% | 22.6% | 10 |
| 12 |  Somalia |
27.5% | 32.1% | 22.8% | 12 |
| 13 |  Benin |
26.1% | 28.4% | 23.8% | 12 |
| 14 |  Liberia |
26.1% | 28.3% | 23.8% | 11 |
| 15 |  Tuvalu |
25.0% | 30.5% | 18.3% | 4 |
| 16 |  DR Congo |
24.9% | 28.2% | 21.6% | 12 |
| 17 |  Burundi |
24.6% | 28.0% | 21.2% | 13 |
| 18 |  Guinea |
24.5% | 26.3% | 22.9% | 12 |
| 19 |  Burkina Faso |
24.1% | 28.0% | 20.4% | 12 |
| 20 |  Mali |
23.9% | 26.5% | 21.1% | 11 |
| 21 |  Togo |
23.8% | 24.6% | 23.1% | 12 |
| 22 |  Mozambique |
23.8% | 30.8% | 17.2% | 11 |
| 23 |  Congo |
23.6% | 26.4% | 20.7% | 11 |
| 24 |  Tanzania |
23.4% | 27.3% | 19.4% | 10 |
| 25 |  Namibia |
23.3% | 29.7% | 16.7% | 10 |
| 26 |  Equatorial Guinea |
22.9% | 25.5% | 19.4% | 11 |
| 27 |  Guinea-Bissau |
22.7% | 26.7% | 18.8% | 11 |
| 28 |  Marshall Islands |
22.7% | 25.9% | 19.2% | 4 |
| 29 |  Cameroon |
22.7% | 26.6% | 18.7% | 11 |
| 30 |  Madagascar |
22.7% | 25.2% | 20.0% | 12 |
| 31 |  Ghana |
22.3% | 26.0% | 18.5% | 12 |
| 32 |  Uganda |
22.3% | 26.3% | 18.4% | 10 |
| 33 |  Fiji |
22.2% | 25.7% | 18.5% | 8 |
| 34 |  Angola |
22.1% | 26.5% | 17.8% | 11 |
| 35 |  Papua New Guinea |
21.9% | 26.3% | 17.2% | 10 |
| 36 |  Haiti |
21.6% | 26.8% | 16.3% | 10 |
| 37 |  Sierra Leone |
21.5% | 23.7% | 19.2% | 11 |
| 38 |  Gambia |
21.4% | 23.9% | 18.9% | 12 |
| 39 |  Malawi |
21.2% | 26.7% | 15.8% | 11 |
| 40 |  Sao Tome |
20.6% | 26.6% | 14.0% | 10 |
| 41 |  Djibouti |
20.5% | 24.2% | 16.8% | 12 |
| 42 |  Rwanda |
20.2% | 24.3% | 16.5% | 10 |
| 43 |  Niger |
20.1% | 21.9% | 18.1% | 10 |
| 44 |  Guyana |
20.0% | 26.1% | 14.1% | 8 |
| 45 |  Gabon |
19.8% | 24.0% | 15.1% | 11 |
| 46 |  Myanmar |
19.8% | 24.8% | 14.6% | 11 |
| 47 |  Palau |
19.5% | 22.3% | 15.7% | 4 |
| 48 |  Sudan |
19.4% | 24.0% | 15.1% | 12 |
| 49 |  Afghanistan |
19.4% | 21.7% | 17.1% | 10 |
| 50 |  Comoros |
19.2% | 22.3% | 15.9% | 10 |
| 51 |  Kiribati |
19.1% | 21.8% | 16.7% | 10 |
| 52 |  Russia |
19.1% | 28.7% | 9.4% | 7 |
| 53 |  Ethiopia |
18.9% | 23.6% | 14.0% | 12 |
| 54 |  Zambia |
18.8% | 22.7% | 14.9% | 11 |
| 55 |  Moldova |
18.8% | 26.9% | 11.1% | 8 |
| 56 |  El Salvador |
18.6% | 27.1% | 11.0% | 8 |
| 57 |  Bolivia |
18.5% | 22.4% | 14.4% | 12 |
| 58 |  Botswana |
18.4% | 22.1% | 14.8% | 11 |
| 59 |  Mongolia |
18.0% | 25.7% | 10.1% | 8 |
| 60 |  Eritrea |
17.9% | 20.9% | 15.1% | 12 |
| 61 |  Philippines |
17.9% | 22.7% | 12.8% | 9 |
| 62 |  East Timor |
17.6% | 19.9% | 15.2% | 10 |
| 63 |  Saint Vincent |
17.4% | 21.2% | 13.2% | 9 |
| 64 |  Mauritania |
17.2% | 19.9% | 14.7% | 10 |
| 65 |  Cambodia |
16.5% | 20.3% | 12.8% | 1 |
| 66 |  Senegal |
16.5% | 19.7% | 13.2% | 11 |
| 67 |  Pakistan |
16.4% | 19.8% | 12.7% | 10 |
| 68 |  Laos |
16.2% | 19.4% | 13.0% | 10 |
| 69 |  Solomon Islands |
16.1% | 18.1% | 14.0% | 11 |
| 70 |  Samoa |
16.1% | 18.1% | 13.9% | 10 |
| 71 |  Bahamas |
16.1% | 20.4% | 11.9% | 10 |
| 72 |  Yemen |
15.9% | 18.9% | 12.8% | 10 |
| 73 |  Indonesia |
15.9% | 18.4% | 13.2% | 10 |
| 74 |  Guatemala |
15.9% | 19.9% | 11.8% | 9 |
| 75 |  Venezuela |
15.8% | 21.2% | 10.2% | 9 |
| 76 |  Kyrgyzstan |
15.8% | 22.0% | 9.6% | 7 |
| 77 |  Jamaica |
15.8% | 19.7% | 11.9% | 10 |
| 78 |  Suriname |
15.7% | 19.3% | 11.7% | 9 |
| 79 |  Ukraine |
15.6% | 23.0% | 8.3% | 9 |
| 80 |  Vanuatu |
15.6% | 18.4% | 12.5% | 10 |
| 81 |  Saint Kitts |
15.5% | 21.0% | 10.0% | 4 |
| 82 |  Turkmenistan |
15.5% | 20.5% | 10.7% | 9 |
| 83 |  Tonga |
15.3% | 20.7% | 10.8% | 10 |
| 84 |  Uzbekistan |
15.3% | 19.3% | 11.2% | 8 |
| 85 |  Seychelles |
15.3% | 19.4% | 9.8% | 10 |
| 86 |  Nepal |
15.0% | 17.3% | 13.1% | 11 |
| 87 |  Belarus |
14.8% | 21.9% | 7.8% | 6 |
| 88 |  Kazakhstan |
14.7% | 20.8% | 8.6% | 10 |
| 89 |  Belize |
14.6% | 19.0% | 10.2% | 9 |
| 90 |  Thailand |
14.5% | 20.3% | 8.7% | 8 |
| 91 |  India |
14.5% | 17.1% | 11.6% | 10 |
| 92 |  Trinidad |
14.1% | 18.0% | 10.0% | 9 |
| 93 |  Lithuania |
13.9% | 20.1% | 7.3% | 5 |
| 94 |  Saint Lucia |
13.9% | 18.7% | 8.9% | 10 |
| 95 |  Georgia |
13.9% | 21.1% | 7.2% | 8 |
| 96 |  Honduras |
13.9% | 17.0% | 10.7% | 10 |
| 97 |  Dominican Republic |
13.8% | 17.6% | 10.0% | 8 |
| 98 |  Mexico |
13.8% | 18.8% | 9.1% | 8 |
| 99 |  Latvia |
13.7% | 19.7% | 7.6% | 9 |
| 100 |  Mauritius |
13.6% | 17.8% | 9.2% | 9 |
| 101 |  Paraguay |
13.4% | 17.4% | 9.2% | 8 |
| 102 |  Tajikistan |
13.4% | 16.4% | 10.5% | 9 |
| 103 |  Grenada |
13.3% | 16.0% | 10.5% | 6 |
| 104 |  Egypt |
13.2% | 16.5% | 9.8% | 10 |
| 105 |  Dominica |
13.2% | 17.7% | 8.4% | 4 |
| 106 |  Iraq |
12.9% | 15.2% | 10.7% | 10 |
| 107 |  Nicaragua |
12.9% | 16.6% | 9.2% | 8 |
| 108 |  Libya |
12.7% | 15.7% | 9.5% | 10 |
| 109 |  North Korea |
12.6% | 15.3% | 9.8% | 11 |
| 110 |  Syria |
12.6% | 15.6% | 9.6% | 11 |
| 111 |  Vietnam |
12.4% | 17.5% | 7.2% | 11 |
| 112 |  Brazil |
12.4% | 16.5% | 8.1% | 9 |
| 113 |  Bulgaria |
12.3% | 16.7% | 7.5% | 9 |
| 114 |  Romania |
12.2% | 17.2% | 7.0% | 9 |
| 115 |  Bangladesh |
11.7% | 13.6% | 9.7% | 10 |
| 116 |  Bhutan |
11.4% | 13.3% | 9.3% | 10 |
| 117 |  Malaysia |
11.3% | 14.4% | 7.8% | 9 |
| 118 |  Brunei |
11.3% | 13.2% | 9.0% | 10 |
| 119 |  Hungary |
11.0% | 14.9% | 7.1% | 11 |
| 120 |  Cape Verde |
11.0% | 15.4% | 6.1% | 8 |
| 121 |  Armenia |
10.9% | 17.0% | 5.6% | 10 |
| 122 |  Barbados |
10.9% | 13.7% | 8.2% | 6 |
| 123 |  Peru |
10.9% | 13.1% | 8.6% | 10 |
| 124 |  Azerbaijan |
10.9% | 15.0% | 6.9% | 9 |
| 125 |  Uruguay |
10.3% | 13.3% | 7.2% | 9 |
| 126 |  United States |
10.2% | 12.8% | 7.5% | 9 |
| 127 |  Ecuador |
10.1% | 12.9% | 7.3% | 8 |
| 128 |  Argentina |
10.1% | 12.2% | 7.8% | 9 |
| 129 |  Antigua |
10.0% | 11.9% | 8.2% | 7 |
| 130 |  Serbia |
10.0% | 13.3% | 6.7% | 6 |
| 131 |  Cayman Islands |
10.0% | 11.5% | 8.3% | 4 |
| 132 |  Poland |
9.8% | 13.9% | 5.4% | 7 |
| 133 |  Montenegro |
9.6% | 12.8% | 6.5% | 10 |
| 134 |  Estonia |
9.5% | 13.6% | 5.2% | 8 |
| 135 |  Cuba |
9.3% | 11.9% | 6.8% | 9 |
| 136 |  Morocco |
9.3% | 11.2% | 7.3% | 11 |
| 137 |  Colombia |
9.1% | 11.9% | 6.3% | 9 |
| 138 |  Sri Lanka |
9.1% | 12.9% | 5.4% | 7 |
| 139 |  Slovakia |
9.1% | 12.6% | 5.4% | 6 |
| 140 |  Curacao |
8.9% | 12.9% | 5.3% | 11 |
| 141 |  Bosnia |
8.5% | 11.3% | 5.8% | 8 |
| 142 |  Panama |
8.4% | 10.8% | 5.9% | 8 |
| 143 |  Taiwan |
8.2% | 11.3% | 5.0% | 9 |
| 144 |  Tunisia |
8.0% | 10.8% | 5.3% | 8 |
| 145 |  Palestine |
8.0% | 10.0% | 6.1% | 11 |
| 146 |  Iran |
7.9% | 10.3% | 5.4% | 10 |
| 147 |  North Macedonia |
7.8% | 10.2% | 5.5% | 6 |
| 148 |  Croatia |
7.8% | 10.8% | 4.8% | 10 |
| 149 |  Costa Rica |
7.8% | 10.2% | 5.3% | 8 |
| 150 |  China |
7.7% | 10.0% | 5.1% | 5 |
| 151 |  Algeria |
7.5% | 8.4% | 6.6% | 9 |
| 152 |  Turkey |
7.5% | 10.3% | 4.6% | 6 |
| 153 |  Chile |
7.2% | 9.0% | 5.4% | 9 |
| 154 |  Saudi Arabia |
7.2% | 8.3% | 5.2% | 3 |
| 155 |  Czech Republic |
7.1% | 9.5% | 4.5% | 10 |
| 156 |  Jordan |
7.0% | 8.3% | 5.5% | 10 |
| 157 |  Lebanon |
6.8% | 8.2% | 5.6% | 10 |
| 158 |  Albania |
6.7% | 9.0% | 4.5% | 8 |
| 159 |  United Kingdom |
6.6% | 8.1% | 5.1% | 9 |
| 160 |  France |
6.4% | 8.5% | 4.3% | 9 |
| 161 |  Portugal |
6.3% | 8.8% | 3.9% | 7 |
| 162 |  Germany |
6.2% | 7.9% | 4.4% | 9 |
| 163 |  Finland |
6.2% | 8.2% | 3.9% | 7 |
| 164 |  Canada |
6.1% | 7.6% | 4.5% | 7 |
| 165 |  New Zealand |
6.0% | 7.2% | 4.8% | 10 |
| 166 |  Belgium |
5.9% | 7.3% | 4.4% | 10 |
| 167 |  Slovenia |
5.7% | 7.6% | 3.7% | 5 |
| 168 |  Greece |
5.6% | 7.8% | 3.4% | 7 |
| 169 |  Austria |
5.5% | 7.2% | 3.9% | 7 |
| 170 |  Oman |
5.5% | 6.1% | 4.4% | 10 |
| 171 |  Denmark |
5.4% | 6.7% | 4.1% | 9 |
| 172 |  Israel |
5.3% | 7.0% | 3.7% | 9 |
| 173 |  Bahrain |
5.3% | 5.6% | 4.8% | 10 |
| 174 |  Luxembourg |
5.3% | 6.2% | 4.3% | 5 |
| 175 |  Ireland |
5.2% | 6.5% | 3.9% | 9 |
| 176 |  Australia |
5.1% | 6.4% | 3.8% | 10 |
| 177 |  Netherlands |
5.1% | 5.8% | 4.3% | 9 |
| 178 |  Spain |
4.9% | 6.6% | 3.3% | 6 |
| 179 |  Malta |
4.8% | 5.7% | 3.7% | 10 |
| 180 |  Japan |
4.6% | 6.0% | 3.2% | 9 |
| 181 |  Singapore |
4.6% | 5.9% | 3.2% | 7 |
| 182 |  Iceland |
4.5% | 5.5% | 3.4% | 9 |
| 183 |  Cyprus |
4.5% | 5.7% | 3.2% | 11 |
| 184 |  Norway |
4.4% | 5.3% | 3.5% | 9 |
| 185 |  Sweden |
4.4% | 5.4% | 3.3% | 9 |
| 186 |  Italy |
4.4% | 5.5% | 3.2% | 7 |
| 187 |  Kuwait |
4.2% | 5.0% | 2.7% | 10 |
| 188 |  Switzerland |
4.1% | 5.2% | 3.0% | 10 |
| 189 |  Maldives |
3.7% | 4.2% | 3.0% | 8 |
| 190 |  South Korea |
3.6% | 5.2% | 2.0% | 12 |
| 191 |  Qatar |
3.5% | 3.8% | 3.0% | 10 |
| 192 |  Liechtenstein |
3.5% | 4.1% | 2.9% | 11 |
| 193 |  Andorra |
3.4% | 4.0% | 2.6% | 11 |
| 194 |  San Marino |
3.2% | 3.5% | 2.9% | 4 |
| 195 |  UAE |
3.0% | 3.6% | 1.8% | 10 |
| 196 |  Monaco |
2.4% | 3.0% | 1.9% | 11 |
In 2026, the chance of a 15-year-old dying before 60 ranges from 39.5% in Lesotho to 2.4% in Monaco. Worldwide, it is 13.1%: 16.1% for men and 10.0% for women.
Adult mortality is the chance that a 15-year-old dies before turning 60; the odds of dying by age are the chances of dying within a year at each age, if the death rates at each age stayed as they are in the year. The figures come from the United Nations' life tables for 2026 (World Population Prospects), which are projections from the latest data.
Adult mortality (probability of dying between 15 and 60) map: UN life tables, 2026 (projected)
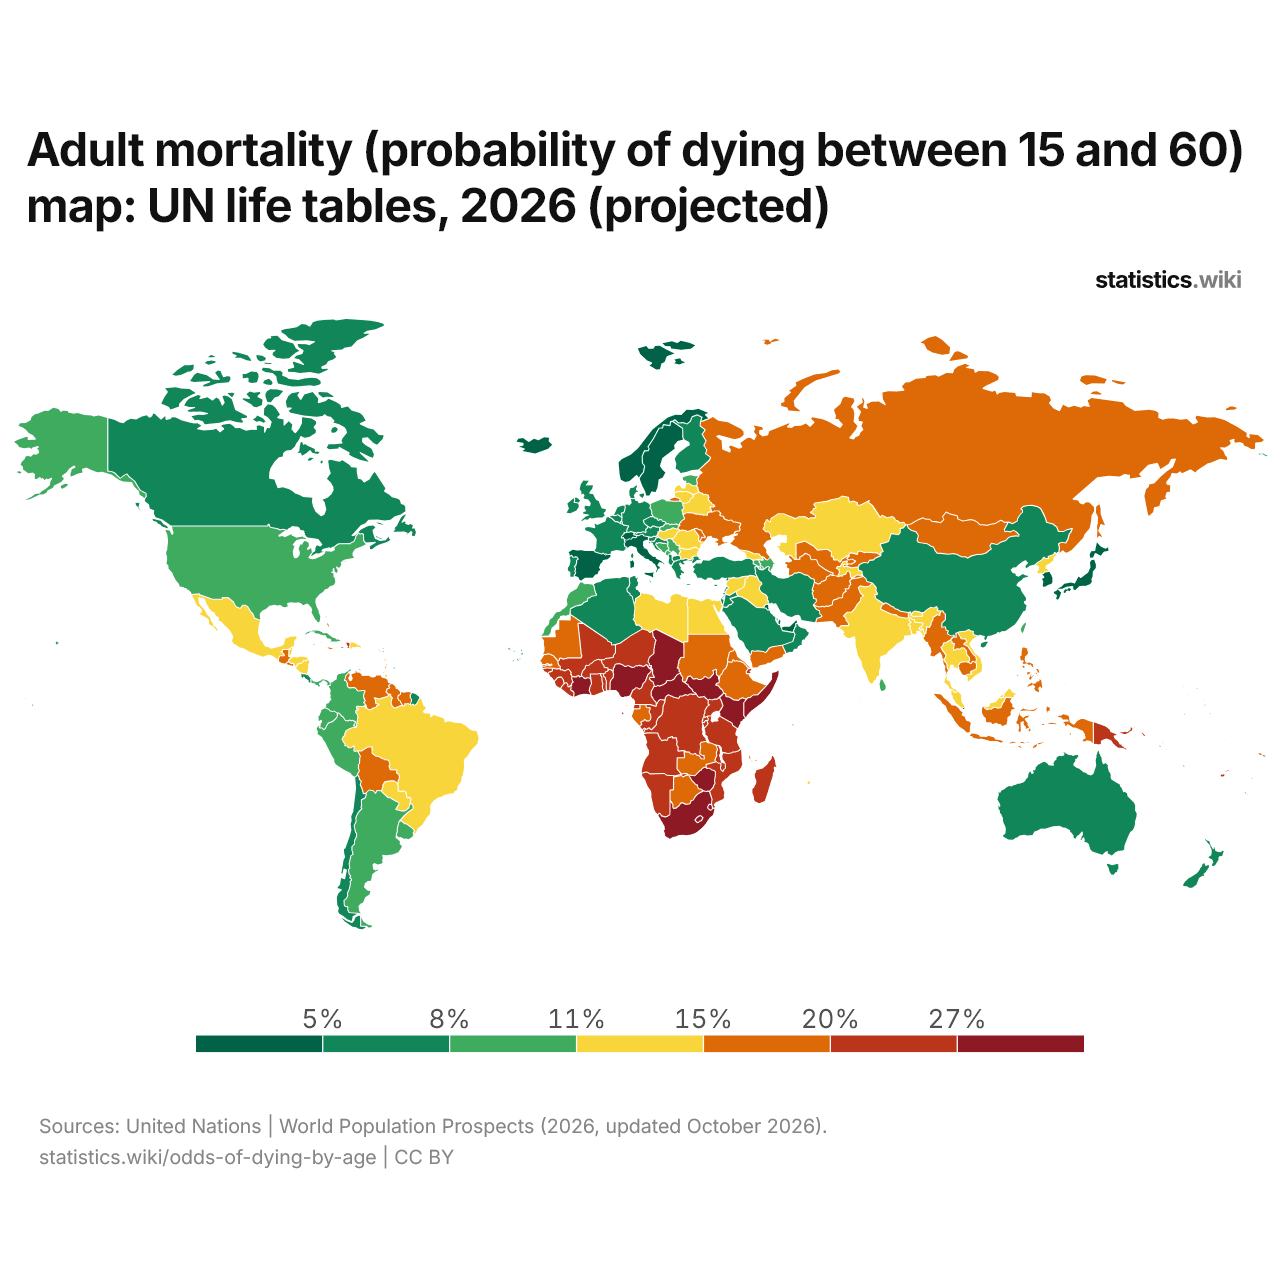
In 2026, the chance of a 15-year-old dying before 60 is above 20.0% in 43 countries and below 8.0% in 53.
Compare the odds of dying by age in any 2 countries
Sources:
- United Nations | World Population Prospects (2026, updated October 2026)
Creative Commons Attribution (CC BY): you may copy, share, adapt and reuse this content, also commercially, as long as you credit statistics.wiki and note any changes you made. The sources listed above may have their own license terms.