
Probability of dying within a year at each age 0–99 in Kiribati: UN life table, 2026 (projected)
| Age | Probability of dying, log scale | ||
|---|---|---|---|
| Men | Women | Both sexes | |
| 0 | 4.62% | 3.6% | 4.13% |
| 1 | 0.437% | 0.416% | 0.427% |
| 2 | 0.331% | 0.298% | 0.315% |
| 3 | 0.252% | 0.216% | 0.234% |
| 4 | 0.194% | 0.159% | 0.177% |
| 5 | 0.153% | 0.12% | 0.137% |
| 6 | 0.124% | 0.095% | 0.11% |
| 7 | 0.104% | 0.079% | 0.092% |
| 8 | 0.092% | 0.069% | 0.081% |
| 9 | 0.084% | 0.064% | 0.074% |
| 10 | 0.081% | 0.062% | 0.071% |
| 11 | 0.081% | 0.063% | 0.072% |
| 12 | 0.085% | 0.066% | 0.076% |
| 13 | 0.092% | 0.072% | 0.082% |
| 14 | 0.102% | 0.08% | 0.091% |
| 15 | 0.116% | 0.089% | 0.103% |
| 16 | 0.133% | 0.1% | 0.116% |
| 17 | 0.151% | 0.111% | 0.13% |
| 18 | 0.17% | 0.121% | 0.145% |
| 19 | 0.187% | 0.131% | 0.159% |
| 20 | 0.202% | 0.14% | 0.17% |
| 21 | 0.213% | 0.147% | 0.18% |
| 22 | 0.22% | 0.153% | 0.187% |
| 23 | 0.223% | 0.159% | 0.191% |
| 24 | 0.223% | 0.164% | 0.194% |
| 25 | 0.221% | 0.17% | 0.196% |
| 26 | 0.22% | 0.175% | 0.197% |
| 27 | 0.219% | 0.18% | 0.2% |
| 28 | 0.22% | 0.186% | 0.203% |
| 29 | 0.224% | 0.192% | 0.208% |
| 30 | 0.229% | 0.199% | 0.214% |
| 31 | 0.237% | 0.207% | 0.221% |
| 32 | 0.246% | 0.215% | 0.23% |
| 33 | 0.257% | 0.224% | 0.24% |
| 34 | 0.269% | 0.234% | 0.251% |
| 35 | 0.283% | 0.245% | 0.263% |
| 36 | 0.299% | 0.257% | 0.277% |
| 37 | 0.316% | 0.269% | 0.292% |
| 38 | 0.336% | 0.283% | 0.308% |
| 39 | 0.358% | 0.299% | 0.327% |
| 40 | 0.383% | 0.316% | 0.348% |
| 41 | 0.412% | 0.335% | 0.371% |
| 42 | 0.443% | 0.356% | 0.397% |
| 43 | 0.479% | 0.379% | 0.426% |
| 44 | 0.519% | 0.406% | 0.459% |
| 45 | 0.563% | 0.435% | 0.496% |
| 46 | 0.612% | 0.468% | 0.536% |
| 47 | 0.665% | 0.504% | 0.58% |
| 48 | 0.724% | 0.544% | 0.628% |
| 49 | 0.787% | 0.587% | 0.682% |
| 50 | 0.857% | 0.634% | 0.739% |
| 51 | 0.934% | 0.684% | 0.8% |
| 52 | 1.02% | 0.738% | 0.867% |
| 53 | 1.11% | 0.796% | 0.94% |
| 54 | 1.22% | 0.859% | 1.02% |
| 55 | 1.33% | 0.927% | 1.11% |
| 56 | 1.45% | 1% | 1.2% |
| 57 | 1.59% | 1.09% | 1.31% |
| 58 | 1.73% | 1.19% | 1.43% |
| 59 | 1.89% | 1.3% | 1.57% |
| 60 | 2.06% | 1.42% | 1.71% |
| 61 | 2.25% | 1.56% | 1.87% |
| 62 | 2.45% | 1.71% | 2.04% |
| 63 | 2.67% | 1.89% | 2.23% |
| 64 | 2.9% | 2.07% | 2.44% |
| 65 | 3.16% | 2.28% | 2.67% |
| 66 | 3.45% | 2.52% | 2.92% |
| 67 | 3.77% | 2.78% | 3.2% |
| 68 | 4.11% | 3.08% | 3.52% |
| 69 | 4.49% | 3.42% | 3.87% |
| 70 | 4.91% | 3.8% | 4.25% |
| 71 | 5.37% | 4.22% | 4.67% |
| 72 | 5.88% | 4.67% | 5.14% |
| 73 | 6.43% | 5.17% | 5.65% |
| 74 | 7.04% | 5.71% | 6.21% |
| 75 | 7.7% | 6.3% | 6.82% |
| 76 | 8.41% | 6.96% | 7.5% |
| 77 | 9.19% | 7.7% | 8.26% |
| 78 | 10% | 8.53% | 9.09% |
| 79 | 11% | 9.45% | 9.99% |
| 80 | 12% | 10.5% | 11% |
| 81 | 13.1% | 11.5% | 12.1% |
| 82 | 14.3% | 12.7% | 13.2% |
| 83 | 15.6% | 13.9% | 14.5% |
| 84 | 16.9% | 15.1% | 15.7% |
| 85 | 18.4% | 16.4% | 17.1% |
| 86 | 20% | 17.8% | 18.5% |
| 87 | 21.6% | 19.3% | 19.9% |
| 88 | 23.3% | 20.8% | 21.5% |
| 89 | 25% | 22.5% | 23.1% |
| 90 | 26.8% | 24.2% | 24.8% |
| 91 | 28.5% | 25.9% | 26.5% |
| 92 | 30.4% | 27.7% | 28.3% |
| 93 | 32.2% | 29.5% | 30.1% |
| 94 | 34% | 31.3% | 31.9% |
| 95 | 35.9% | 33.1% | 33.8% |
| 96 | 37.7% | 34.9% | 35.6% |
| 97 | 39.6% | 36.7% | 37.4% |
| 98 | 41.4% | 38.5% | 39.2% |
| 99 | 43.1% | 40.3% | 40.9% |
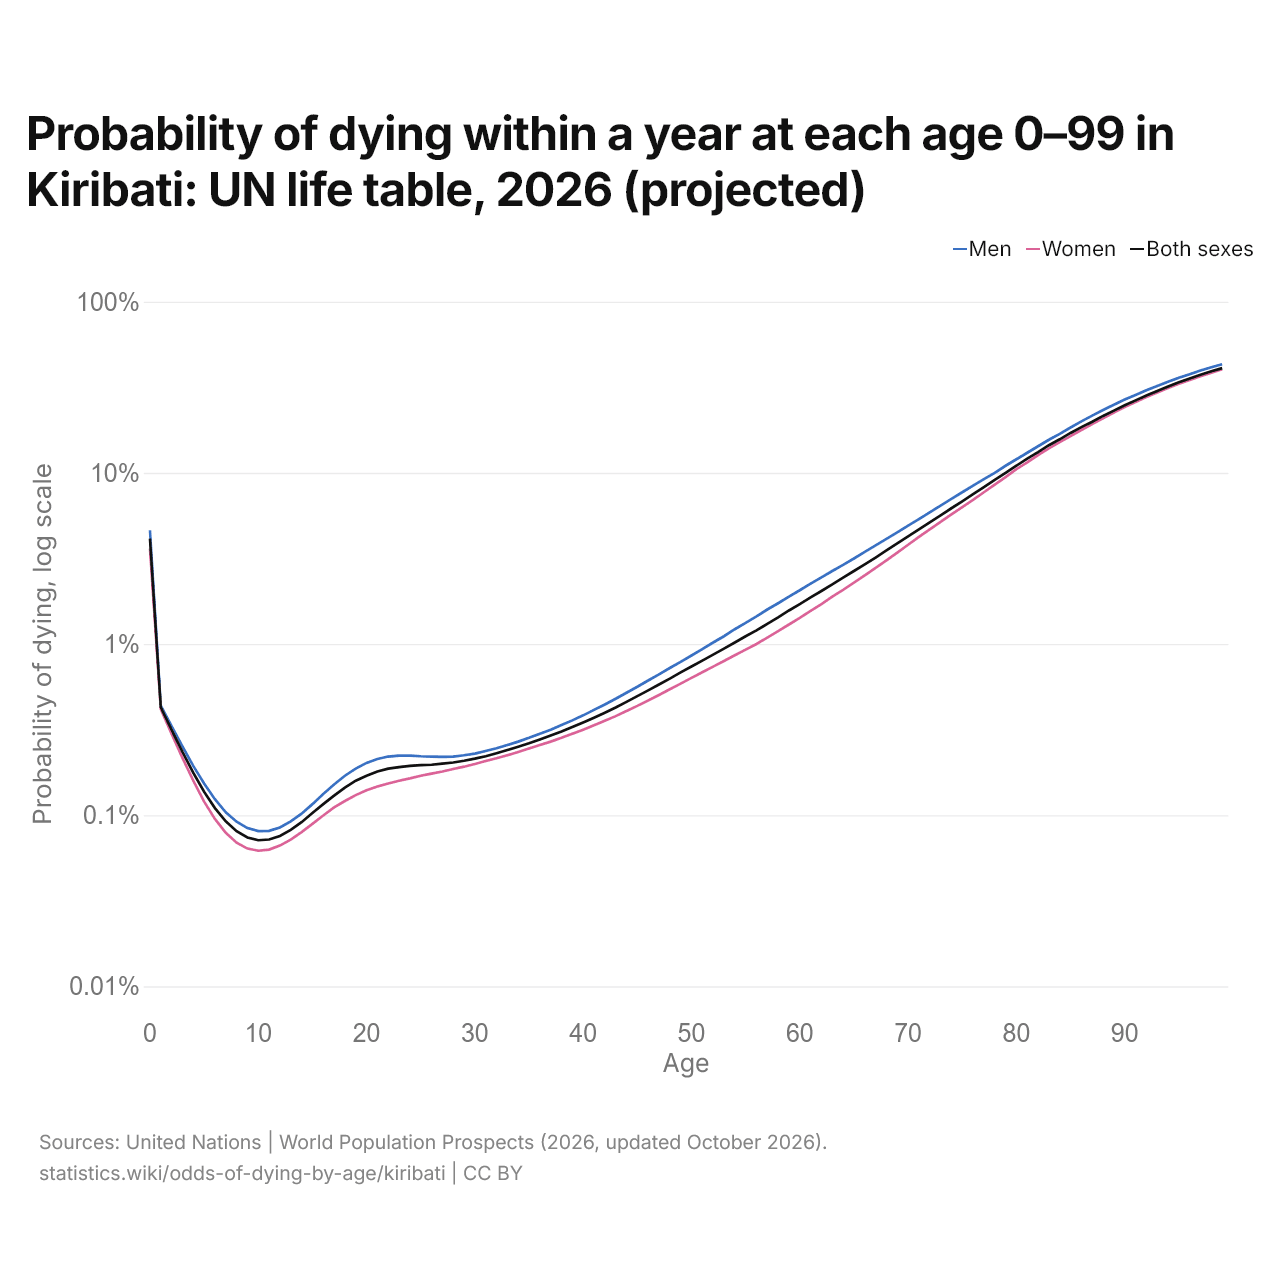
In 2026, the risk of dying within a year in Kiribati is 4.1% at birth; it is lowest at the age of 10, at 0.071%. At 80, it is 12.0% for men and 10.5% for women in Kiribati.
Of people aged 15 in Kiribati, 19.1% would die before reaching 60: 21.8% of men and 16.7% of women. Kiribati's adult mortality is the 7th highest of the 13 countries of Oceania, where it ranges from Australia's 5.1% to Nauru's 34.0%.
Probability of dying by age in Kiribati: UN life table, 2026 (projected)
| Men | Women | Both sexes | |
|---|---|---|---|
| Within a year at 20 | 0.20% | 0.14% | 0.17% |
| Within a year at 40 | 0.38% | 0.32% | 0.35% |
| Within a year at 60 | 2.1% | 1.4% | 1.7% |
| Within a year at 80 | 12.0% | 10.5% | 11.0% |
| Adult mortality, 15 to 60 | 21.8% | 16.7% | 19.1% |
| Lowest-risk age | 10 | 10 | 10 |
| Years for the risk to double, ages 40–90 | 7.8 | 7.5 | 7.7 |
Kiribati in the world ranking of adult mortality (dying at 15–60): UN life tables, 2026 (projected)







Compare the odds of dying by age in Kiribati with other countries
Sources:
- United Nations | World Population Prospects (2026, updated October 2026)
Creative Commons Attribution (CC BY): you may copy, share, adapt and reuse this content, also commercially, as long as you credit statistics.wiki and note any changes you made. The sources listed above may have their own license terms.