
List of countries by inflation rate (2025)
| Rank | Country | Inflation rate | 5-year average | 10-year average |
|---|---|---|---|---|
 World |
3.0% median | 4.6% | 3.4% | |
| 1 |  Venezuela |
252.0% | 306.7% | 1,112% |
| 2 |  Sudan |
138.8% (2022) | 134.7% | 73.2% |
| 3 |  South Sudan |
91.4% (2024) | 21.3% | 69.0% |
| 4 |  Zimbabwe |
81.4% | 268.3% | 165.5% |
| 5 |  Iran |
42.2% | 41.1% | 30.2% |
| 6 |  Argentina |
41.9% | 93.5% | n/a |
| 7 |  Turkey |
34.9% | 46.6% | 28.4% |
| 8 |  Burundi |
34.1% | 21.4% | 12.8% |
| 9 |  Haiti |
28.6% | 28.5% | 21.6% |
| 10 |  Malawi |
28.4% | 23.6% | 17.7% |
| 11 |  Nigeria |
23.0% | 23.2% | 18.4% |
| 12 |  Angola |
20.2% | 21.7% | 22.8% |
| 13 |  Bolivia |
19.5% | 5.7% | 4.0% |
| 14 |  Lebanon |
14.6% | 105.8% | 54.4% |
| 15 |  Ghana |
14.2% | 22.8% | 16.7% |
| 16 |  Egypt |
14.1% | 18.6% | 16.3% |
| 17 |  Zambia |
13.9% | 14.5% | 12.9% |
| 18 |  Syria |
13.4% (2019) | 22.6% | 20.4% |
| 19 |  Ethiopia |
13.2% | 24.8% | 19.0% |
| 20 |  Ukraine |
12.7% | 12.2% | 11.1% |
| 21 |  Gambia |
11.6% (2024) | 10.6% | 8.9% |
| 22 |  Kazakhstan |
11.4% | 11.5% | 9.7% |
| 23 |  Bangladesh |
10.0% | 8.1% | 6.8% |
| 24 |  Palestine |
9.8% | 13.4% | 6.6% |
| 25 |  Suriname |
9.2% | 36.1% | n/a |
| 26 |  Myanmar |
8.8% (2019) | 7.3% | 6.1% |
| 27 |  Uzbekistan |
8.8% | 10.1% | 11.8% |
| 28 |  Russia |
8.7% | 8.6% | 6.4% |
| 29 |  Mongolia |
8.6% | 9.5% | 7.0% |
| 30 |  Liberia |
8.3% | 8.4% | 12.9% |
| 31 |  Kyrgyzstan |
8.2% | 9.9% | 6.1% |
| 32 |  Yemen |
8.1% (2014) | 11.9% | 11.4% |
| 33 |  Madagascar |
8.1% | 7.9% | 7.2% |
| 34 |  Moldova |
7.8% | 11.6% | 8.2% |
| 35 |  Laos |
7.7% | 17.3% | 9.7% |
| 36 |  Sierra Leone |
7.6% | 23.8% | 19.1% |
| 37 |  Romania |
7.3% | 8.4% | 5.2% |
| 38 |  Belarus |
6.6% | 8.3% | 7.5% |
| 39 |  Nauru |
6.1% | 4.6% | 4.2% |
| 40 |  Rwanda |
5.9% | 8.6% | 7.1% |
| 41 |  Kiribati |
5.9% | 5.0% | 2.8% |
| 42 |  Azerbaijan |
5.6% | 7.4% | 6.9% |
| 43 |  Tonga |
5.6% | 6.3% | 4.7% |
| 44 |  Cuba |
5.5% (2020) | n/a | n/a |
| 45 |  Tunisia |
5.3% | 7.1% | 6.4% |
| 46 |  Colombia |
5.1% | 7.4% | 5.8% |
| 47 |  Brazil |
5.0% | 6.3% | 5.4% |
| 48 |  Estonia |
4.8% | 8.2% | 4.9% |
| 49 |  Uruguay |
4.7% | 6.4% | 7.3% |
| 50 |  Honduras |
4.6% | 5.9% | 4.8% |
| 51 |  Papua New Guinea |
4.4% | 3.4% | 4.2% |
| 52 |  Hungary |
4.4% | 8.8% | 5.6% |
| 53 |  Mozambique |
4.4% | 6.3% | 7.4% |
| 54 |  Lesotho |
4.3% | 6.2% | 5.7% |
| 55 |  Chile |
4.2% | 6.4% | 4.6% |
| 56 |  Marshall Islands |
4.1% | 4.8% | 2.3% |
| 56 |  North Macedonia |
4.1% | 6.8% | 3.8% |
| 58 |  Iceland |
4.1% | 6.3% | 4.3% |
| 59 |  Kenya |
4.1% | 6.0% | 6.0% |
| 60 |  Paraguay |
4.0% | 5.4% | 4.3% |
| 61 |  Jamaica |
4.0% | 6.4% | 5.2% |
| 62 |  Slovakia |
4.0% | 6.6% | 4.0% |
| 63 |  Bosnia |
4.0% | 5.5% | 2.7% |
| 64 |  Montenegro |
3.9% | 6.2% | 3.5% |
| 65 |  Serbia |
3.9% | 7.3% | 4.6% |
| 66 |  United Kingdom |
3.9% | 4.9% | 3.3% |
| 67 |  Dominican Republic |
3.9% | 5.8% | 4.3% |
| 68 |  Georgia |
3.9% | 5.7% | 4.9% |
| 69 |  Poland |
3.8% | 7.6% | 4.7% |
| 70 |  Mexico |
3.8% | 5.5% | 4.8% |
| 71 |  Lithuania |
3.8% | 7.4% | 4.8% |
| 72 |  Latvia |
3.7% | 6.8% | 4.2% |
| 73 |  Somalia |
3.7% | 5.4% | 4.4% |
| 74 |  Croatia |
3.7% | 5.5% | 3.0% |
| 75 |  Mauritius |
3.7% | 5.8% | 4.0% |
| 76 |  Afghanistan |
3.6% | 1.8% | 2.7% |
| 76 |  Uganda |
3.6% | 4.3% | 4.0% |
| 78 |  Pakistan |
3.5% | 14.9% | 10.7% |
| 79 |  Austria |
3.5% | 5.1% | 3.3% |
| 80 |  Bulgaria |
3.5% | 6.0% | 3.6% |
| 80 |  Maldives |
3.5% | 2.1% | 1.4% |
| 80 |  Namibia |
3.5% | 4.7% | 4.6% |
| 83 |  Cameroon |
3.4% | 4.8% | 3.1% |
| 84 |  Tajikistan |
3.4% | 5.2% | 5.9% |
| 85 |  Solomon Islands |
3.4% | 3.8% | 2.8% |
| 86 |  Tanzania |
3.3% | 3.6% | 3.9% |
| 87 |  Armenia |
3.3% | 4.2% | 2.6% |
| 87 |  Guyana |
3.3% | 4.1% | 2.7% |
| 87 |  Vietnam |
3.3% | 3.0% | 3.1% |
| 90 |  South Africa |
3.2% | 5.1% | 4.9% |
| 91 |  Netherlands |
3.2% | 4.6% | 3.0% |
| 92 |  Comoros |
3.2% | 5.7% | 3.6% |
| 93 |  Japan |
3.2% | 2.3% | 1.3% |
| 94 |  Guinea |
3.1% | 7.2% | 8.3% |
| 95 |  Israel |
3.0% | 3.2% | 1.7% |
| 96 |  Norway |
3.0% | 4.2% | 3.3% |
| 97 |  United States |
2.9% (2024) | 4.2% | 2.9% |
| 98 |  Tuvalu |
2.9% | 5.7% | 4.4% |
| 99 |  DR Congo |
2.9% (2016) | 3.0% | 7.3% |
| 100 |  Australia |
2.9% | 4.2% | 2.9% |
| 101 |  New Zealand |
2.8% | 4.5% | 3.0% |
| 102 |  Turkmenistan |
2.7% | 7.0% | 7.1% |
| 103 |  Spain |
2.7% | 4.1% | 2.4% |
| 104 |  Botswana |
2.7% | 5.8% | 4.3% |
| 105 |  Nepal |
2.7% | 5.2% | 5.3% |
| 106 |  Curacao |
2.6% (2019) | 1.2% | 1.7% |
| 107 |  Bhutan |
2.6% | 5.1% | 4.2% |
| 107 |  Congo |
2.6% | 3.0% | 2.2% |
| 109 |  Eswatini |
2.6% (2019) | 5.3% | 5.7% |
| 110 |  Dominica |
2.5% | 3.1% | 2.0% |
| 111 |  Cambodia |
2.5% | 2.7% | 2.7% |
| 112 |  Greece |
2.5% | 3.9% | 1.9% |
| 113 |  Belgium |
2.5% | 4.3% | 3.0% |
| 114 |  Czech Republic |
2.5% | 6.8% | 4.5% |
| 115 |  India |
2.4% | 5.0% | 4.7% |
| 116 |  Slovenia |
2.4% | 4.5% | 2.7% |
| 117 |  Malta |
2.4% | 3.3% | 2.2% |
| 118 |  Kuwait |
2.4% | 3.3% | 2.5% |
| 119 |  Portugal |
2.3% | 3.6% | 2.1% |
| 120 |  Cape Verde |
2.3% | 3.4% | 1.9% |
| 120 |  Equatorial Guinea |
2.3% | 2.6% | 2.2% |
| 120 |  Mali |
2.3% | 4.2% | 2.1% |
| 123 |  Luxembourg |
2.3% | 3.4% | 2.3% |
| 124 |  Samoa |
2.2% | 5.2% | 3.3% |
| 125 |  Ireland |
2.2% | 4.1% | 2.2% |
| 126 |  Albania |
2.2% | 3.6% | 2.6% |
| 126 |  San Marino |
2.2% | 3.2% | 1.9% |
| 128 |  Germany |
2.2% | 4.0% | 2.5% |
| 129 |  South Korea |
2.1% | 3.1% | 2.1% |
| 130 |  Nicaragua |
2.1% | 6.1% | 5.2% |
| 131 |  Canada |
2.1% | 3.7% | 2.6% |
| 132 |  Saudi Arabia |
2.0% | 2.3% | 1.7% |
| 133 |  Saint Lucia |
2.0% | 3.4% | 1.4% |
| 134 |  Indonesia |
1.9% | 2.7% | 2.9% |
| 135 |  Denmark |
1.9% | 3.2% | 1.9% |
| 136 |  Libya |
1.8% | 2.7% | 7.4% |
| 137 |  Gabon |
1.8% | 2.4% | 2.5% |
| 138 |  Jordan |
1.8% | 2.2% | 1.9% |
| 139 |  Taiwan |
1.7% | 2.3% | 1.5% |
| 140 |  Philippines |
1.7% | 4.1% | 3.5% |
| 141 |  Mauritania |
1.5% | 4.4% | 3.3% |
| 142 |  Italy |
1.5% | 3.6% | 2.1% |
| 143 |  Peru |
1.5% | 4.5% | 3.5% |
| 144 |  Monaco |
1.5% (2020) | n/a | n/a |
| 145 |  Guatemala |
1.5% | 4.3% | 4.1% |
| 146 |  Senegal |
1.5% | 4.0% | 2.7% |
| 147 |  Algeria |
1.4% | 6.2% | 5.2% |
| 148 |  Antigua |
1.4% | 4.3% | 2.7% |
| 149 |  Malaysia |
1.4% | 2.3% | 1.8% |
| 150 |  Eritrea |
1.3% (2019) | −1.8% | 2.7% |
| 150 |  UAE |
1.3% | 1.8% | 1.2% |
| 152 |  Bahamas |
1.1% | 2.6% | 1.9% |
| 153 |  Belize |
1.1% | 3.6% | 2.1% |
| 153 |  Benin |
1.1% | 1.6% | 1.2% |
| 155 |  CAR |
1.0% | 3.1% | 3.0% |
| 155 |  Oman |
1.0% | 1.4% | 1.0% |
| 157 |  Trinidad |
1.0% | 2.8% | 2.1% |
| 158 |  France |
0.9% | 2.9% | 1.9% |
| 159 |  Singapore |
0.9% | 3.3% | 1.7% |
| 160 |  Guinea-Bissau |
0.9% | 4.6% | 2.7% |
| 160 |  Sao Tome |
0.9% | 12.3% | 9.8% |
| 162 |  Barbados |
0.8% | n/a | n/a |
| 163 |  Saint Vincent |
0.8% | 3.2% | 2.1% |
| 164 |  Saint Kitts |
0.8% | 1.9% | 0.7% |
| 165 |  Ecuador |
0.7% | 1.6% | 1.0% |
| 166 |  Morocco |
0.7% | 3.1% | 2.1% |
| 167 |  Sweden |
0.7% | 4.5% | 2.9% |
| 168 |  Vanuatu |
0.7% | 4.3% | 3.6% |
| 169 |  Grenada |
0.6% | 1.6% | 1.1% |
| 170 |  Qatar |
0.6% | 2.4% | 1.2% |
| 171 |  East Timor |
0.5% | 4.3% | 2.4% |
| 172 |  Togo |
0.4% | 4.2% | 2.4% |
| 173 |  Finland |
0.3% | 3.5% | 2.1% |
| 174 |  Iraq |
0.3% | 3.6% | 2.0% |
| 175 |  Seychelles |
0.3% | 2.3% | 2.0% |
| 176 |  El Salvador |
0.3% | 3.1% | 1.8% |
| 177 |  Palau |
0.2% | 5.6% | 3.1% |
| 178 |  Switzerland |
0.2% | 1.3% | 0.7% |
| 179 |  Cyprus |
0.1% | 3.2% | 1.6% |
| 180 |  Ivory Coast |
0.1% | 3.5% | 2.2% |
| 181 |  China |
0.0% | 0.7% | 1.4% |
| 182 |  Costa Rica |
−0.1% | 2.0% | 1.6% |
| 183 |  Thailand |
−0.1% | 1.7% | 1.0% |
| 184 |  Bahrain |
−0.1% | 0.8% | 0.9% |
| 185 |  Panama |
−0.2% | 1.3% | 0.7% |
| 186 |  Djibouti |
−0.3% | 1.9% | 1.8% |
| 187 |  Brunei |
−0.3% | 1.0% | 0.6% |
| 188 |  Liechtenstein |
−0.4% (2020) | n/a | n/a |
| 189 |  Burkina Faso |
−0.6% | 4.3% | 2.4% |
| 190 |  Cayman Islands |
−0.6% (2016) | 0.3% | n/a |
| 191 |  Andorra |
−0.9% (2020) | n/a | n/a |
| 192 |  Fiji |
−1.4% | 2.6% | 2.4% |
| 193 |  Chad |
−2.6% | 2.4% | 0.9% |
| 194 |  Niger |
−4.5% | 3.2% | 2.4% |
| 195 |  Sri Lanka |
−4.8% | 12.1% | 8.3% |
The list ranks 195 countries by their latest inflation rate, from Venezuela (252.0%) to Sri Lanka (−4.8%). The world's median inflation rate was 3.0% in 2025.
The inflation rate here is the change of consumer prices over a year, measured by the consumer price index (CPI): how much more the goods and services that households buy cost than a year before, in % (a negative rate means that prices fell). The 5-year and 10-year averages are compound: the same rate every year would give the same rise in prices over the period.
Inflation rate by country map, 1992–2025
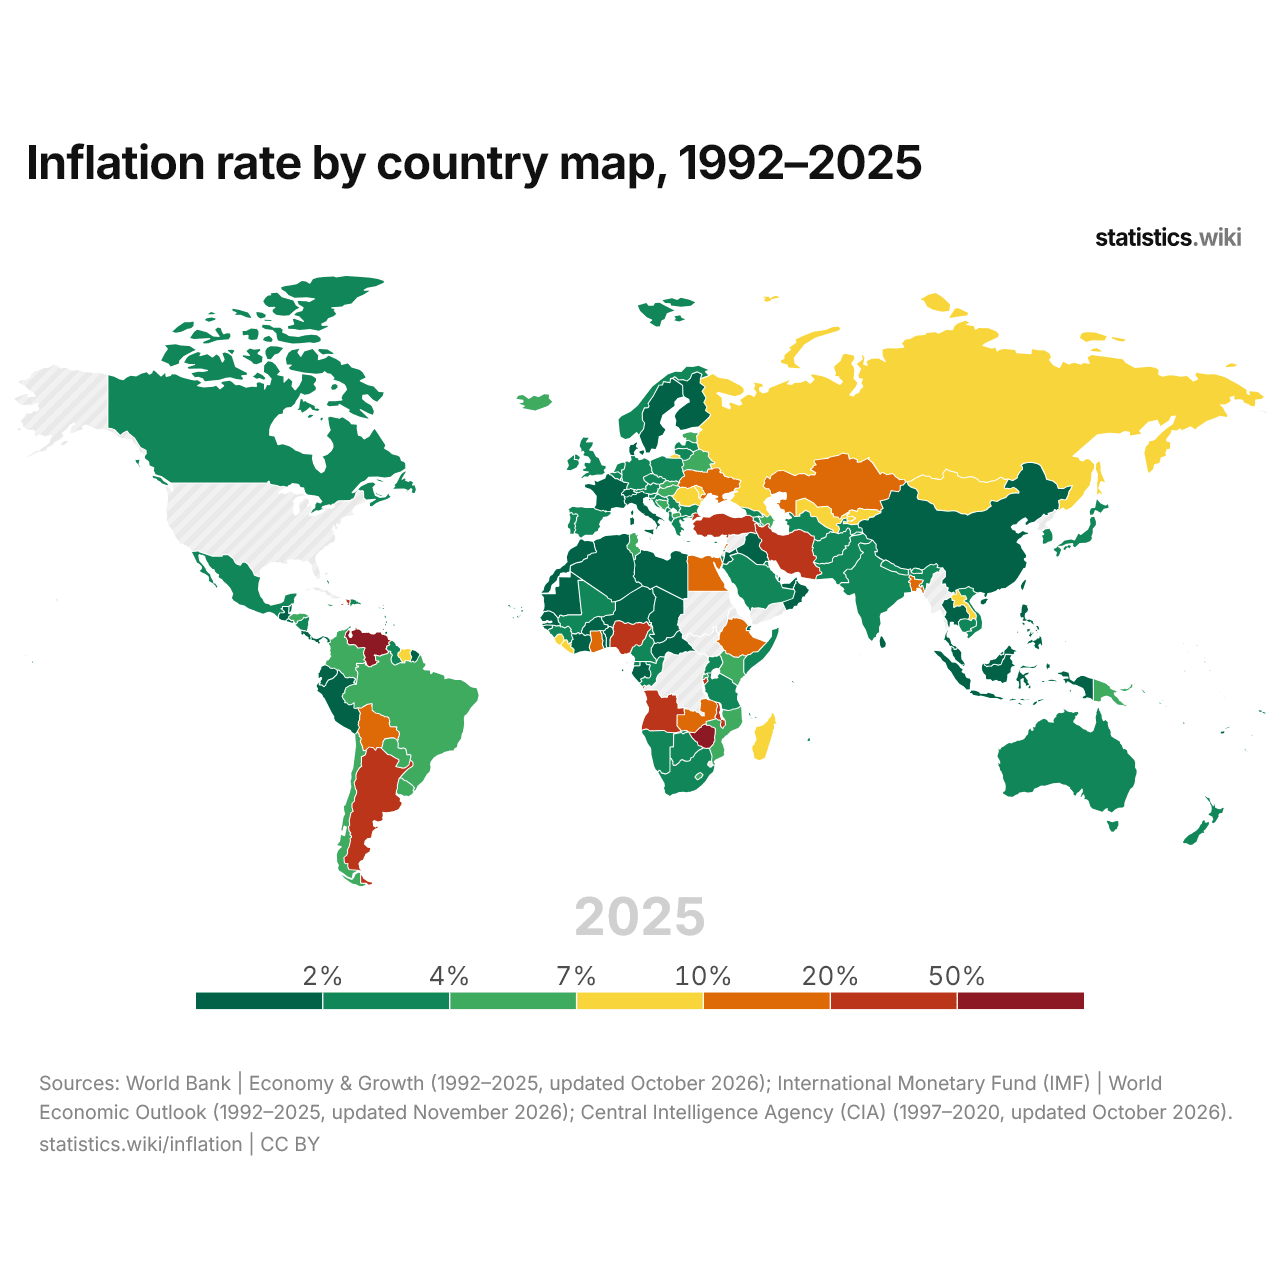
In 2025, consumer prices fell in 11 countries and rose more than 10% in 18; in 1992, they fell in 15 and rose more than 10% in 76.
Inflation rate in the 5 largest economies, 2000–2025
| Year | Inflation rate | ||||
|---|---|---|---|---|---|
| United Kingdom | Japan | United States | Germany | China | |
| 2025 | 3.9% | 3.2% | - | 2.2% | 0% |
| 2024 | 3.3% | 2.7% | 2.9% | 2.3% | 0.2% |
| 2023 | 6.8% | 3.3% | 4.1% | 5.9% | 0.2% |
| 2022 | 7.9% | 2.5% | 8% | 6.9% | 2% |
| 2021 | 2.5% | −0.2% | 4.7% | 3.1% | 0.9% |
| 2020 | 1% | 0% | 1.2% | 0.1% | 2.5% |
| 2019 | 1.7% | 0.5% | 1.8% | 1.4% | 2.9% |
| 2018 | 2.3% | 1% | 2.4% | 1.7% | 2.1% |
| 2017 | 2.6% | 0.5% | 2.1% | 1.5% | 1.6% |
| 2016 | 1% | −0.1% | 1.3% | 0.5% | 2% |
| 2015 | 0.4% | 0.8% | 0.1% | 0.5% | 1.5% |
| 2014 | 1.5% | 2.8% | 1.6% | 0.9% | 2% |
| 2013 | 2.3% | 0.3% | 1.5% | 1.5% | 2.6% |
| 2012 | 2.6% | 0% | 2.1% | 2% | 2.6% |
| 2011 | 3.9% | −0.3% | 3.2% | 2.1% | 5.4% |
| 2010 | 2.5% | −0.7% | 1.6% | 1.1% | 3.3% |
| 2009 | 2% | −1.4% | −0.4% | 0.3% | −0.7% |
| 2008 | 3.5% | 1.4% | 3.8% | 2.6% | 5.8% |
| 2007 | 2.4% | 0.1% | 2.9% | 2.3% | 4.8% |
| 2006 | 2.5% | 0.2% | 3.2% | 1.6% | 1.5% |
| 2005 | 2.1% | −0.3% | 3.4% | 1.5% | 1.8% |
| 2004 | 1.4% | 0% | 2.7% | 1.7% | 3.9% |
| 2003 | 1.4% | −0.3% | 2.3% | 1% | 1.2% |
| 2002 | 1.5% | −0.9% | 1.6% | 1.4% | −0.7% |
| 2001 | 1.5% | −0.7% | 2.8% | 2% | 0.7% |
| 2000 | 1.2% | −0.7% | 3.4% | 1.4% | 0.3% |
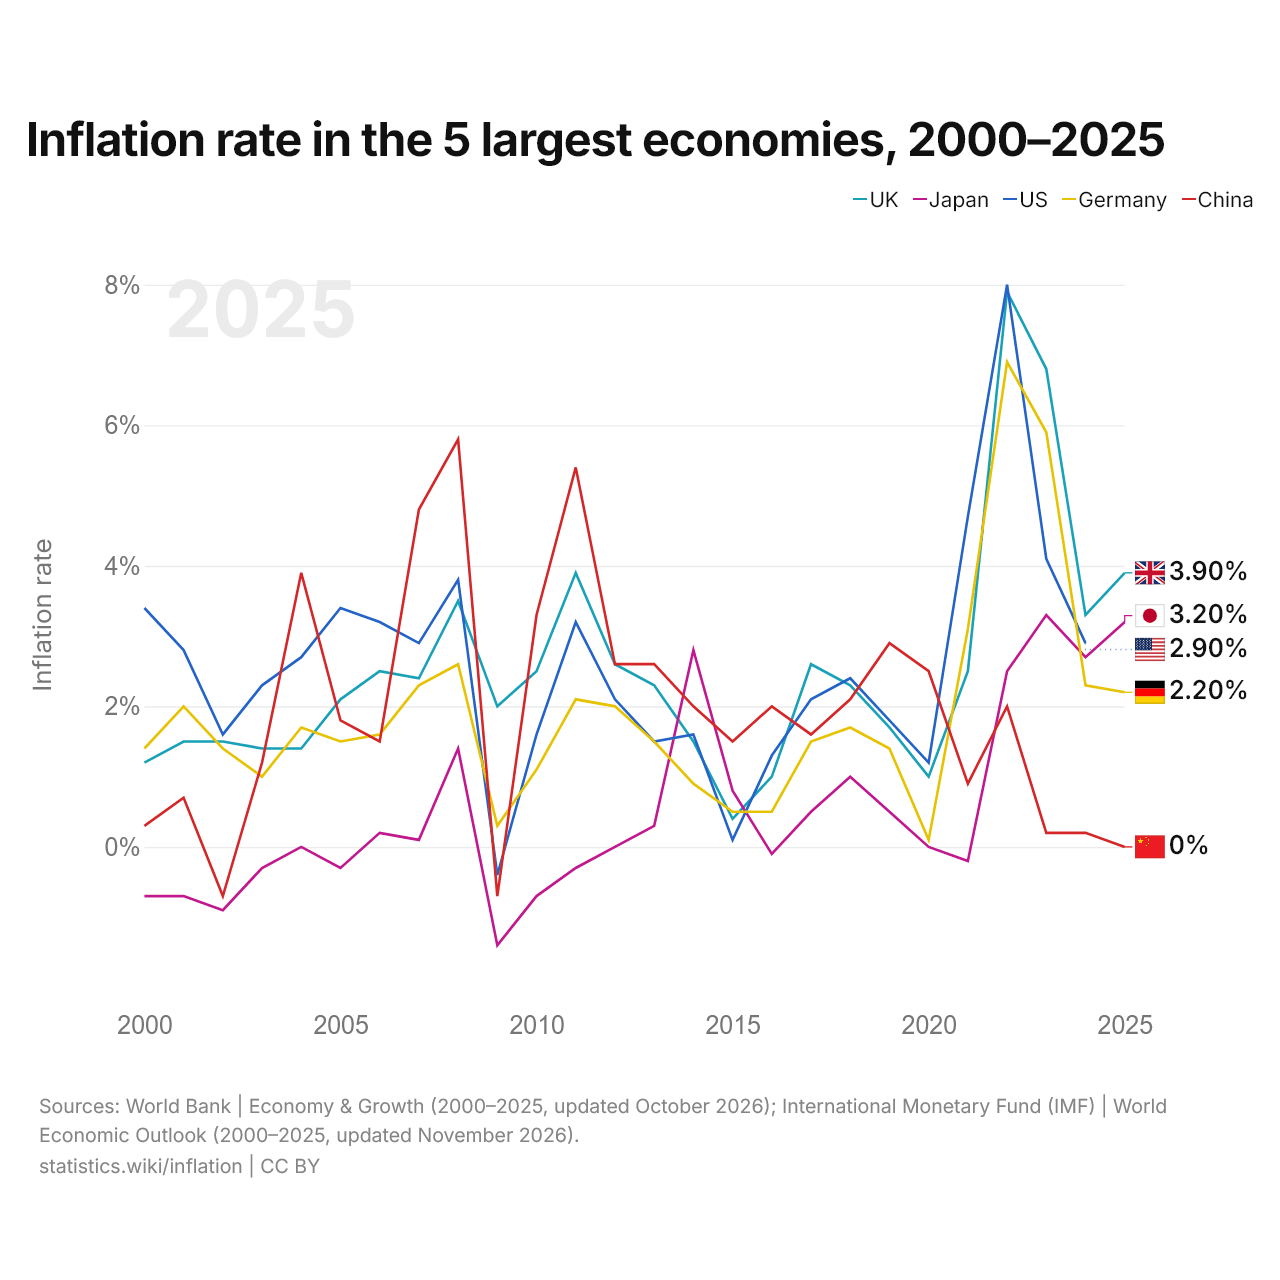
In 2025, inflation was 3.9% in the United Kingdom, 3.2% in Japan, 2.9% in the United States (2024), 2.2% in Germany and 0.0% in China.
World inflation rate by year (median), 1981–2025
| Year | Inflation rate |
|---|---|
| World (median) | |
| 2025 | 3% |
| 2024 | 3% |
| 2023 | 5.7% |
| 2022 | 8% |
| 2021 | 3.5% |
| 2020 | 1.9% |
| 2019 | 2.2% |
| 2018 | 2.5% |
| 2017 | 2.3% |
| 2016 | 1.6% |
| 2015 | 1.4% |
| 2014 | 2.4% |
| 2013 | 2.6% |
| 2012 | 3.7% |
| 2011 | 4.8% |
| 2010 | 3.3% |
| 2009 | 2.9% |
| 2008 | 8.9% |
| 2007 | 4.8% |
| 2006 | 4.3% |
| 2005 | 4.1% |
| 2004 | 3.5% |
| 2003 | 3% |
| 2002 | 2.9% |
| 2001 | 3.8% |
| 2000 | 3.4% |
| 1999 | 3% |
| 1998 | 5.1% |
| 1997 | 5.6% |
| 1996 | 6.5% |
| 1995 | 9.1% |
| 1994 | 10.2% |
| 1993 | 7.1% |
| 1992 | 7.6% |
| 1991 | 9% |
| 1990 | 8.1% |
| 1989 | 6.9% |
| 1988 | 7.1% |
| 1987 | 5.7% |
| 1986 | 5.8% |
| 1985 | 6.8% |
| 1984 | 8.1% |
| 1983 | 8.7% |
| 1982 | 10.2% |
| 1981 | 12.4% |
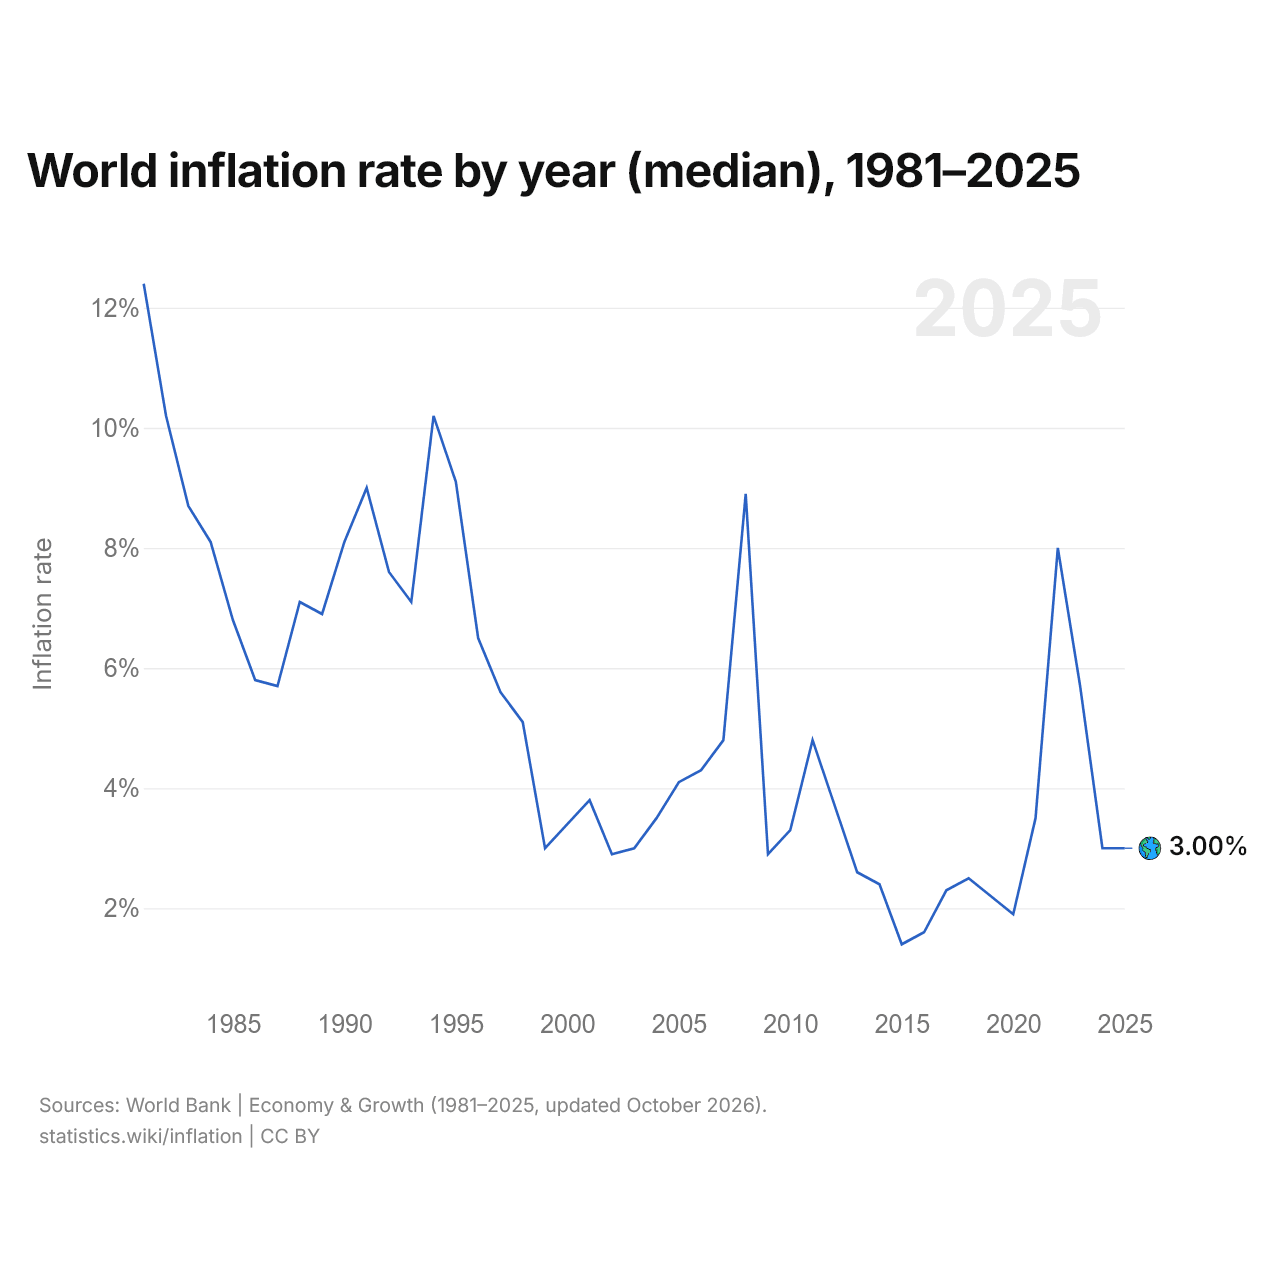
The world's median inflation rate was 3.0% in 2025, after 3.0% in 2024. It was highest in 1981, at 12.4%, and lowest in 2015, at 1.4%.
Countries with inflation above 100% a year
| Country | Years above 100% | Highest inflation rate |
|---|---|---|
|
Venezuela
|
2015–2023, 2025 | 65,374% (2018) |
|
Zimbabwe
|
2002–2008, 2019–2020, 2022–2024 | 231,150,889% (2008) |
|
Argentina
|
2023–2024 | 219.9% (2024) |
|
Lebanon
|
1987–1988, 2021–2023 | 487.2% (1987) |
|
Sudan
|
1991–1994, 1996, 2020–2022 | 359.1% (2021) |
|
South Sudan
|
2016–2017 | 380.0% (2016) |
|
Angola
|
1992–2002 | 4,146% (1996) |
|
DR Congo
|
1979, 1989, 1991–1997, 1999–2001 | 23,773% (1994) |
|
Belarus
|
1992–1995, 1999–2000 | 2,221% (1994) |
|
Laos
|
1980, 1985, 1999 | 188.8% (1980) |
|
Bulgaria
|
1991, 1996–1997 | 1,061% (1997) |
|
Romania
|
1990–1994, 1997 | 256.1% (1993) |
|
Turkmenistan
|
1993–1996 | 3,102% (1993) |
|
Tajikistan
|
1993–1996 | 2,601% (1993) |
|
Armenia
|
1993–1995 | 5,273% (1994) |
|
Ukraine
|
1992–1995 | 4,735% (1993) |
|
Kazakhstan
|
1993–1995 | 1,662% (1993) |
|
Azerbaijan
|
1993–1995 | 1,662% (1994) |
|
Russia
|
1991–1995 | 1,569% (1992) |
|
Uzbekistan
|
1992–1995 | 1,568% (1994) |
|
Iraq
|
1991, 1993–1995 | 448.5% (1994) |
|
Suriname
|
1993–1995 | 368.5% (1994) |
|
Georgia
|
1995 | 162.7% (1995) |
|
Brazil
|
1981–1994 | 2,948% (1990) |
|
Moldova
|
1992–1994 | 1,614% (1993) |
|
Croatia
|
1987–1994 | 1,500% (1993) |
|
Kyrgyzstan
|
1993–1994 | 1,086% (1993) |
|
North Macedonia
|
1993–1994 | 338.7% (1993) |
|
Mongolia
|
1991–1994 | 268.4% (1993) |
|
Turkey
|
1994 | 105.2% (1994) |
|
Lithuania
|
1992–1993 | 1,021% (1992) |
|
Latvia
|
1992–1993 | 951.7% (1992) |
|
Cambodia
|
1990–1991, 1993 | 191.0% (1991) |
|
Zambia
|
1989, 1992–1993 | 158.4% (1993) |
|
Slovenia
|
1987–1992 | 1,281% (1989) |
|
Albania
|
1992 | 226.0% (1992) |
|
Nicaragua
|
1984–1991 | 13,110% (1987) |
|
Peru
|
1983–1985, 1988–1991 | 7,482% (1990) |
|
Sierra Leone
|
1987, 1990–1991 | 178.7% (1987) |
|
Uruguay
|
1968, 1990–1991 | 125.3% (1968) |
|
Guyana
|
1991 | 103.1% (1991) |
|
Poland
|
1982, 1989–1990 | 567.9% (1990) |
|
Uganda
|
1983, 1986–1989 | 215.4% (1987) |
|
Vietnam
|
1986–1988 | 453.5% (1986) |
|
Mexico
|
1983, 1987–1988 | 131.8% (1987) |
|
Mozambique
|
1987 | 164.1% (1987) |
|
Bolivia
|
1982–1986 | 11,750% (1985) |
|
Israel
|
1980–1985 | 373.2% (1984) |
|
Guinea-Bissau
|
1985 | 112.7% (1985) |
|
Ghana
|
1977, 1981, 1983 | 122.9% (1983) |
|
Chile
|
1973–1976 | 504.7% (1974) |
|
Indonesia
|
1962–1968 | 1,136% (1966) |
Inflation has been above 100% a year at least once in 52 countries; the highest rate was Zimbabwe's, 231,150,889%, in 2008. In 2025, it was above that in one country: Venezuela.
Compare the inflation rate of any 2 countries
Sources:
- World Bank | Economy & Growth (1966–2025, updated October 2026)
- International Monetary Fund (IMF) | World Economic Outlook (1980–2025, updated November 2026)
- Central Intelligence Agency (CIA) (1997–2020, updated October 2026)
Creative Commons Attribution (CC BY): you may copy, share, adapt and reuse this content, also commercially, as long as you credit statistics.wiki and note any changes you made. The sources listed above may have their own license terms.