
Kenya inflation rate chart: yearly change in consumer prices, 1960–2025
| Year | Inflation rate |
|---|---|
 Kenya |
|
| 2025 | 4.1% |
| 2024 | 4.5% |
| 2023 | 7.7% |
| 2022 | 7.7% |
| 2021 | 6.1% |
| 2020 | 5.4% |
| 2019 | 5.2% |
| 2018 | 4.7% |
| 2017 | 8% |
| 2016 | 6.3% |
| 2015 | 6.6% |
| 2014 | 6.9% |
| 2013 | 5.7% |
| 2012 | 9.4% |
| 2011 | 14% |
| 2010 | 4% |
| 2009 | 9.2% |
| 2008 | 26.2% |
| 2007 | 9.8% |
| 2006 | 14.5% |
| 2005 | 10.3% |
| 2004 | 11.6% |
| 2003 | 9.8% |
| 2002 | 2% |
| 2001 | 5.7% |
| 2000 | 10% |
| 1999 | 5.7% |
| 1998 | 6.7% |
| 1997 | 11.4% |
| 1996 | 8.9% |
| 1995 | 1.6% |
| 1994 | 28.8% |
| 1993 | 46% |
| 1992 | 27.3% |
| 1991 | 20.1% |
| 1990 | 17.8% |
| 1989 | 13.8% |
| 1988 | 12.3% |
| 1987 | 8.6% |
| 1986 | 2.5% |
| 1985 | 13% |
| 1984 | 10.3% |
| 1983 | 11.4% |
| 1982 | 20.7% |
| 1981 | 11.6% |
| 1980 | 13.9% |
| 1979 | 8% |
| 1978 | 16.9% |
| 1977 | 14.8% |
| 1976 | 11.4% |
| 1975 | 19.1% |
| 1974 | 17.8% |
| 1973 | 9.3% |
| 1972 | 5.8% |
| 1971 | 3.8% |
| 1970 | 2.2% |
| 1969 | −0.2% |
| 1968 | 0.4% |
| 1967 | 1.8% |
| 1966 | 5% |
| 1965 | 3.6% |
| 1964 | −0.1% |
| 1963 | 0.7% |
| 1962 | 3.1% |
| 1961 | 2.5% |
| 1960 | 1.2% |
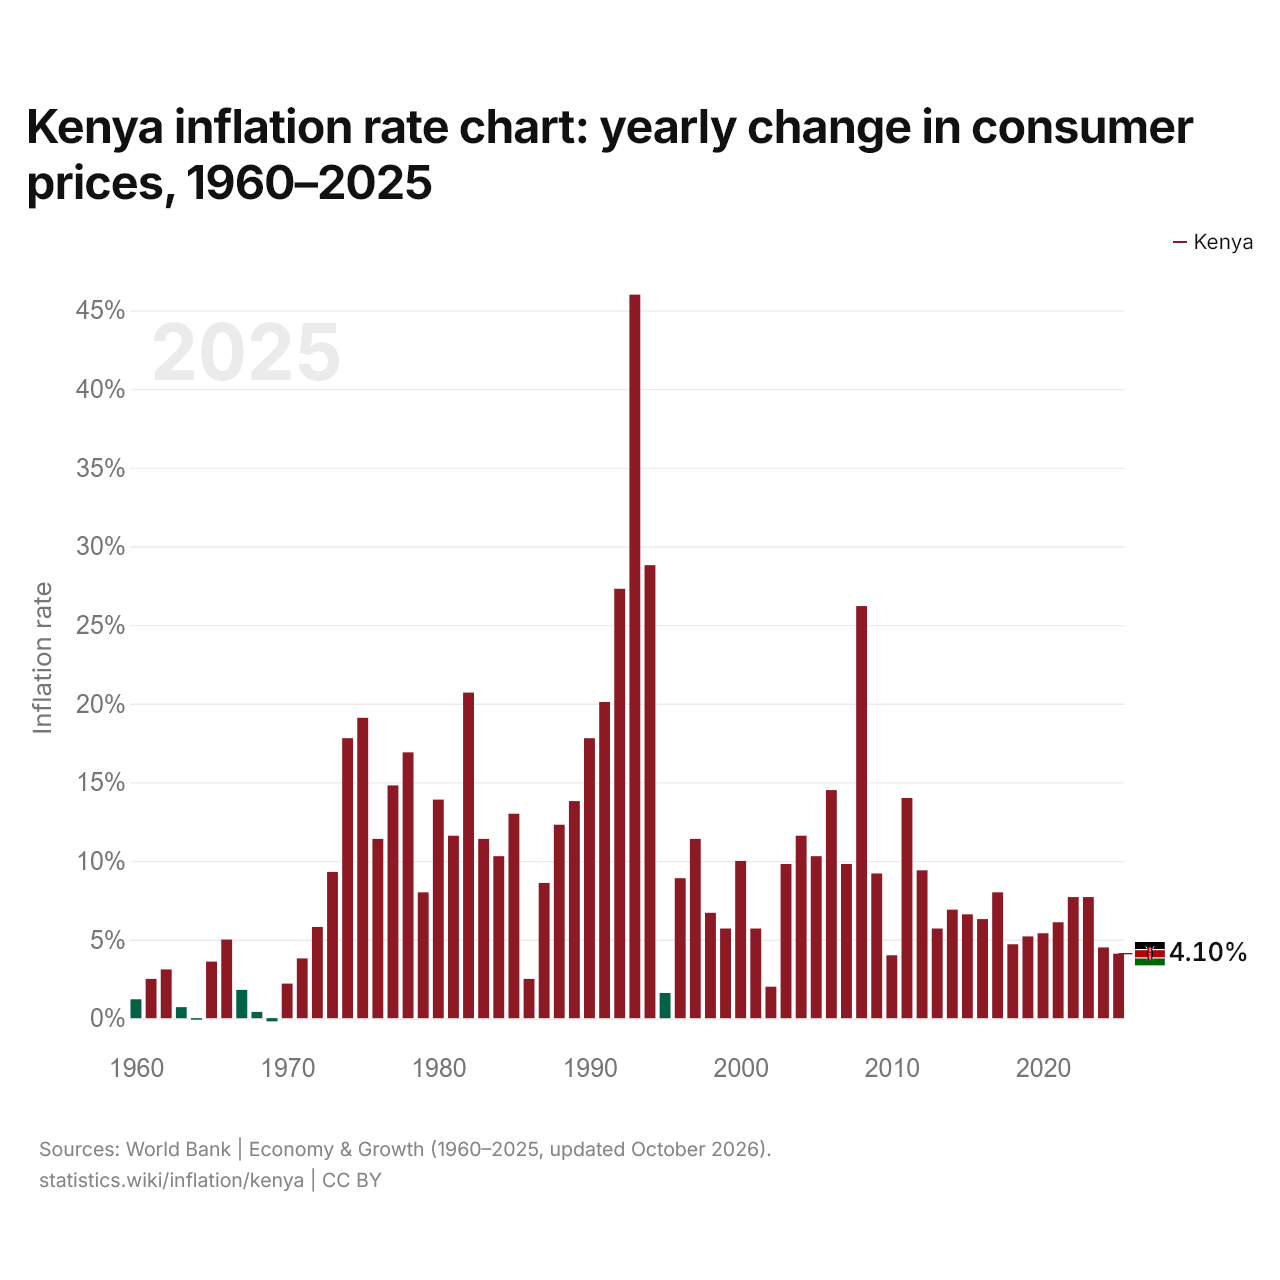
In 2025, consumer prices in Kenya rose 4.1%, after a rise of 4.5% in 2024. Inflation was highest in 1993, at 46.0%, and prices fell the most in 1969, by 0.2%. Prices in Kenya fell in two years: 1964 and 1969.
By decade, consumer prices in Kenya rose the most from 1990 to 1999, by 16.8% a year on average, and the least from 1960 to 1969, by 1.8% a year. Consumer prices in Kenya rose more than 10% in 24 of the years from 1960 to 2025, most recently in 2011.
Kenya's inflation rate in 2025 was the 20th highest of the 54 countries of Africa, where it ranged from Niger's −4.5% to Sudan's 138.8% (2022).
Kenya inflation rate: averages, highest and lowest
| Inflation rate, 2025 | 4.1% |
|---|---|
| Average per year, 2021–2025 | 6.0% |
| Average per year, 2016–2025 | 6.0% |
| Price rise, 2000–2025 | +603% |
| Highest inflation rate | 46.0% (1993) |
| Lowest inflation rate | −0.2% (1969) |
Compare Kenya inflation rate with other countries
Sources:
- World Bank | Economy & Growth (1960–2025, updated October 2026)
Creative Commons Attribution (CC BY): you may copy, share, adapt and reuse this content, also commercially, as long as you credit statistics.wiki and note any changes you made. The sources listed above may have their own license terms.