
Italie vs Danemark : dépenses militaires ($ US), 1960–2025
| Année | $ US | |
|---|---|---|
 Italie |
 Danemark |
|
| 2025 | 48 191 950 223 $ US | 15 045 307 962 $ US |
| 2024 | 37 891 046 740 $ US | 9 630 891 141 $ US |
| 2023 | 35 539 882 188 $ US | 8 142 586 607 $ US |
| 2022 | 33 705 138 369 $ US | 5 472 748 572 $ US |
| 2021 | 35 042 939 552 $ US | 5 274 439 884 $ US |
| 2020 | 31 709 876 816 $ US | 4 885 548 211 $ US |
| 2019 | 25 204 296 904 $ US | 4 487 478 756 $ US |
| 2018 | 27 720 190 921 $ US | 4 558 786 678 $ US |
| 2017 | 25 318 414 528 $ US | 3 780 312 393 $ US |
| 2016 | 24 466 986 405 $ US | 3 593 436 189 $ US |
| 2015 | 21 758 102 542 $ US | 3 364 047 774 $ US |
| 2014 | 27 182 587 397 $ US | 4 056 861 511 $ US |
| 2013 | 29 965 955 446 $ US | 4 216 646 319 $ US |
| 2012 | 29 779 320 055 $ US | 4 422 461 491 $ US |
| 2011 | 33 873 119 723 $ US | 4 518 588 835 $ US |
| 2010 | 32 052 063 964 $ US | 4 503 496 131 $ US |
| 2009 | 34 191 528 917 $ US | 4 337 331 418 $ US |
| 2008 | 36 989 117 642 $ US | 4 788 058 296 $ US |
| 2007 | 32 024 755 220 $ US | 4 175 652 589 $ US |
| 2006 | 29 659 374 964 $ US | 3 896 717 562 $ US |
| 2005 | 29 749 474 102 $ US | 3 468 458 704 $ US |
| 2004 | 30 315 407 065 $ US | 3 578 808 566 $ US |
| 2003 | 26 884 475 683 $ US | 3 199 143 859 $ US |
| 2002 | 21 712 045 457 $ US | 2 694 085 906 $ US |
| 2001 | 19 536 460 030 $ US | 2 525 231 893 $ US |
| 2000 | 19 928 200 276 $ US | 2 392 522 671 $ US |
| 1999 | 21 024 160 491 $ US | 2 784 897 222 $ US |
| 1998 | 20 824 567 972 $ US | 2 846 078 080 $ US |
| 1997 | 20 155 552 296 $ US | 2 804 300 098 $ US |
| 1996 | 20 792 241 686 $ US | 3 086 208 978 $ US |
| 1995 | 17 185 321 883 $ US | 3 117 949 450 $ US |
| 1994 | 18 881 163 591 $ US | 2 718 768 670 $ US |
| 1993 | 19 072 186 259 $ US | 2 682 027 792 $ US |
| 1992 | 23 182 235 663 $ US | 2 837 759 481 $ US |
| 1991 | 23 218 788 335 $ US | 2 671 929 962 $ US |
| 1990 | 22 267 621 236 $ US | 2 696 292 300 $ US |
| 1989 | 18 862 020 125 $ US | 2 273 446 184 $ US |
| 1988 | 18 524 379 534 $ US | 2 411 867 529 $ US |
| 1987 | 16 638 800 693 $ US | 2 218 222 740 $ US |
| 1986 | 12 690 533 500 $ US | 1 706 553 505 $ US |
| 1985 | 8 776 781 153 $ US | 1 314 418 685 $ US |
| 1984 | 8 815 717 870 $ US | 1 315 996 832 $ US |
| 1983 | 8 954 546 721 $ US | 1 426 676 771 $ US |
| 1982 | 8 588 158 289 $ US | 1 453 974 927 $ US |
| 1981 | 7 861 661 357 $ US | 1 498 802 937 $ US |
| 1980 | 8 436 506 569 $ US | 1 673 336 248 $ US |
| 1979 | 7 394 353 725 $ US | 1 584 918 352 $ US |
| 1978 | 5 935 974 686 $ US | 1 370 364 571 $ US |
| 1977 | 4 881 878 871 $ US | 1 101 762 175 $ US |
| 1976 | 4 117 623 156 $ US | 980 949 933 $ US |
| 1975 | 4 507 887 565 $ US | 968 943 517 $ US |
| 1974 | 4 141 759 708 $ US | 762 656 414 $ US |
| 1973 | 3 862 366 624 $ US | 606 932 156 $ US |
| 1972 | 3 481 428 752 $ US | 506 422 361 $ US |
| 1971 | 2 797 811 667 $ US | 450 858 280 $ US |
| 1970 | 2 339 293 004 $ US | 414 783 353 $ US |
| 1969 | 2 446 544 102 $ US | 368 663 989 $ US |
| 1968 | 2 423 414 384 $ US | 361 400 270 $ US |
| 1967 | 2 336 033 650 $ US | 337 996 142 $ US |
| 1966 | 2 290 030 317 $ US | 314 610 126 $ US |
| 1965 | 1 943 006 598 $ US | 307 872 371 $ US |
| 1964 | 1 792 439 346 $ US | 275 120 243 $ US |
| 1963 | 1 653 051 934 $ US | 257 496 781 $ US |
| 1962 | 1 380 496 682 $ US | 240 051 552 $ US |
| 1961 | 1 200 696 728 $ US | 182 586 510 $ US |
| 1960 | 1 140 144 043 $ US | 173 588 446 $ US |
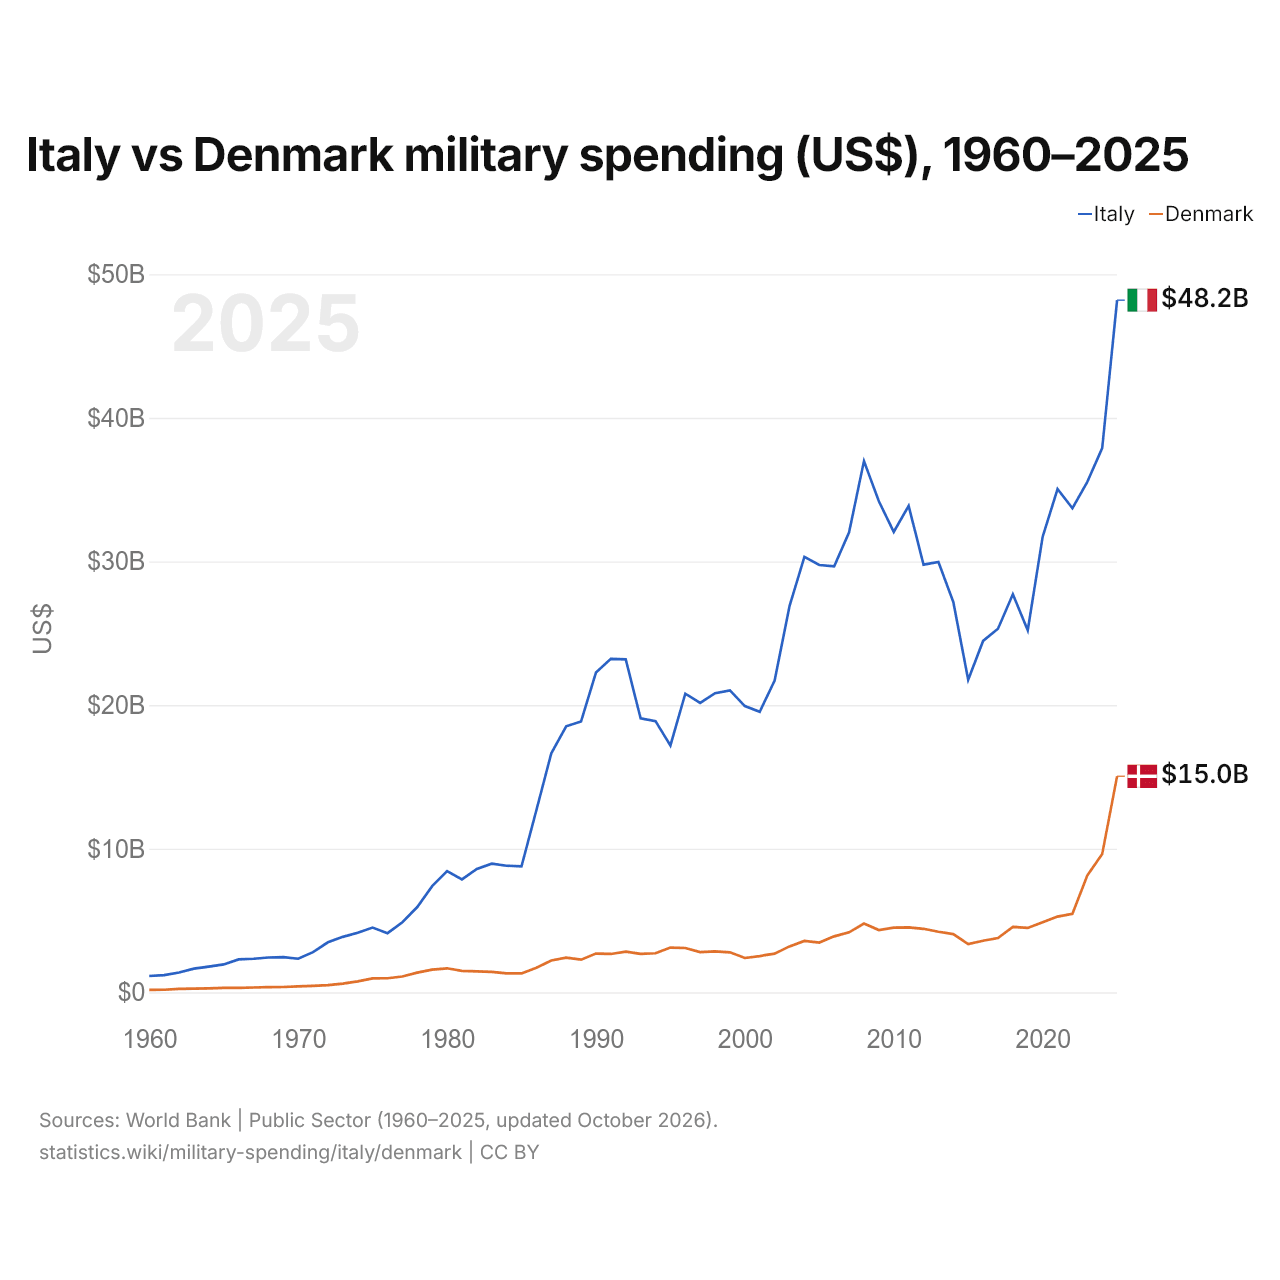
En 2025, les dépenses militaires s'élevaient à 48,2 milliards de dollars en Italie et à 15 milliards de dollars au Danemark : 3,2 fois plus en Italie. En 1960, elles s'élevaient à 1,14 milliard de dollars en Italie et à 174 millions de dollars au Danemark, soit 6,6 fois plus en Italie.
Italie vs Danemark : dépenses militaires en % du PIB, 1960–2025
| Année | % du PIB | |
|---|---|---|
|
Italie
|
Danemark
|
|
| 2025 | 1,9 % | 3,3 % |
| 2024 | 1,6 % | 2,3 % |
| 2023 | 1,5 % | 2 % |
| 2022 | 1,6 % | 1,4 % |
| 2021 | 1,6 % | 1,3 % |
| 2020 | 1,7 % | 1,4 % |
| 2019 | 1,2 % | 1,3 % |
| 2018 | 1,3 % | 1,3 % |
| 2017 | 1,3 % | 1,1 % |
| 2016 | 1,3 % | 1,2 % |
| 2015 | 1,2 % | 1,1 % |
| 2014 | 1,3 % | 1,1 % |
| 2013 | 1,4 % | 1,2 % |
| 2012 | 1,4 % | 1,4 % |
| 2011 | 1,5 % | 1,3 % |
| 2010 | 1,5 % | 1,4 % |
| 2009 | 1,5 % | 1,3 % |
| 2008 | 1,5 % | 1,3 % |
| 2007 | 1,4 % | 1,3 % |
| 2006 | 1,5 % | 1,4 % |
| 2005 | 1,6 % | 1,3 % |
| 2004 | 1,7 % | 1,4 % |
| 2003 | 1,7 % | 1,5 % |
| 2002 | 1,7 % | 1,5 % |
| 2001 | 1,7 % | 1,5 % |
| 2000 | 1,7 % | 1,5 % |
| 1999 | 1,7 % | 1,6 % |
| 1998 | 1,6 % | 1,6 % |
| 1997 | 1,6 % | 1,6 % |
| 1996 | 1,6 % | 1,6 % |
| 1995 | 1,5 % | 1,7 % |
| 1994 | 1,7 % | 1,7 % |
| 1993 | 1,8 % | 1,9 % |
| 1992 | 1,8 % | 1,9 % |
| 1991 | 1,9 % | 1,9 % |
| 1990 | 1,9 % | 2 % |
| 1989 | 2 % | 2 % |
| 1988 | 2,1 % | 2,1 % |
| 1987 | 2,1 % | 2 % |
| 1986 | 2 % | 1,9 % |
| 1985 | 1,9 % | 2,1 % |
| 1984 | 2 % | 2,2 % |
| 1983 | 2 % | 2,4 % |
| 1982 | 2 % | 2,4 % |
| 1981 | 1,8 % | 2,4 % |
| 1980 | 1,8 % | 2,4 % |
| 1979 | 1,9 % | 2,3 % |
| 1978 | 1,9 % | 2,3 % |
| 1977 | 1,9 % | 2,2 % |
| 1976 | 1,8 % | 2,2 % |
| 1975 | 2 % | 2,4 % |
| 1974 | 2,1 % | 2,2 % |
| 1973 | 2,2 % | 2 % |
| 1972 | 2,4 % | 2,2 % |
| 1971 | 2,2 % | 2,4 % |
| 1970 | 2,1 % | 2,4 % |
| 1969 | 2,4 % | 2,4 % |
| 1968 | 2,6 % | 2,7 % |
| 1967 | 2,8 % | 2,6 % |
| 1966 | 3 % | 2,6 % |
| 1965 | 2,7 % | 2,8 % |
| 1964 | 2,7 % | 2,8 % |
| 1963 | 2,8 % | 3 % |
| 1962 | 2,6 % | 3 % |
| 1961 | 2,6 % | 2,6 % |
| 1960 | 2,7 % | 2,7 % |
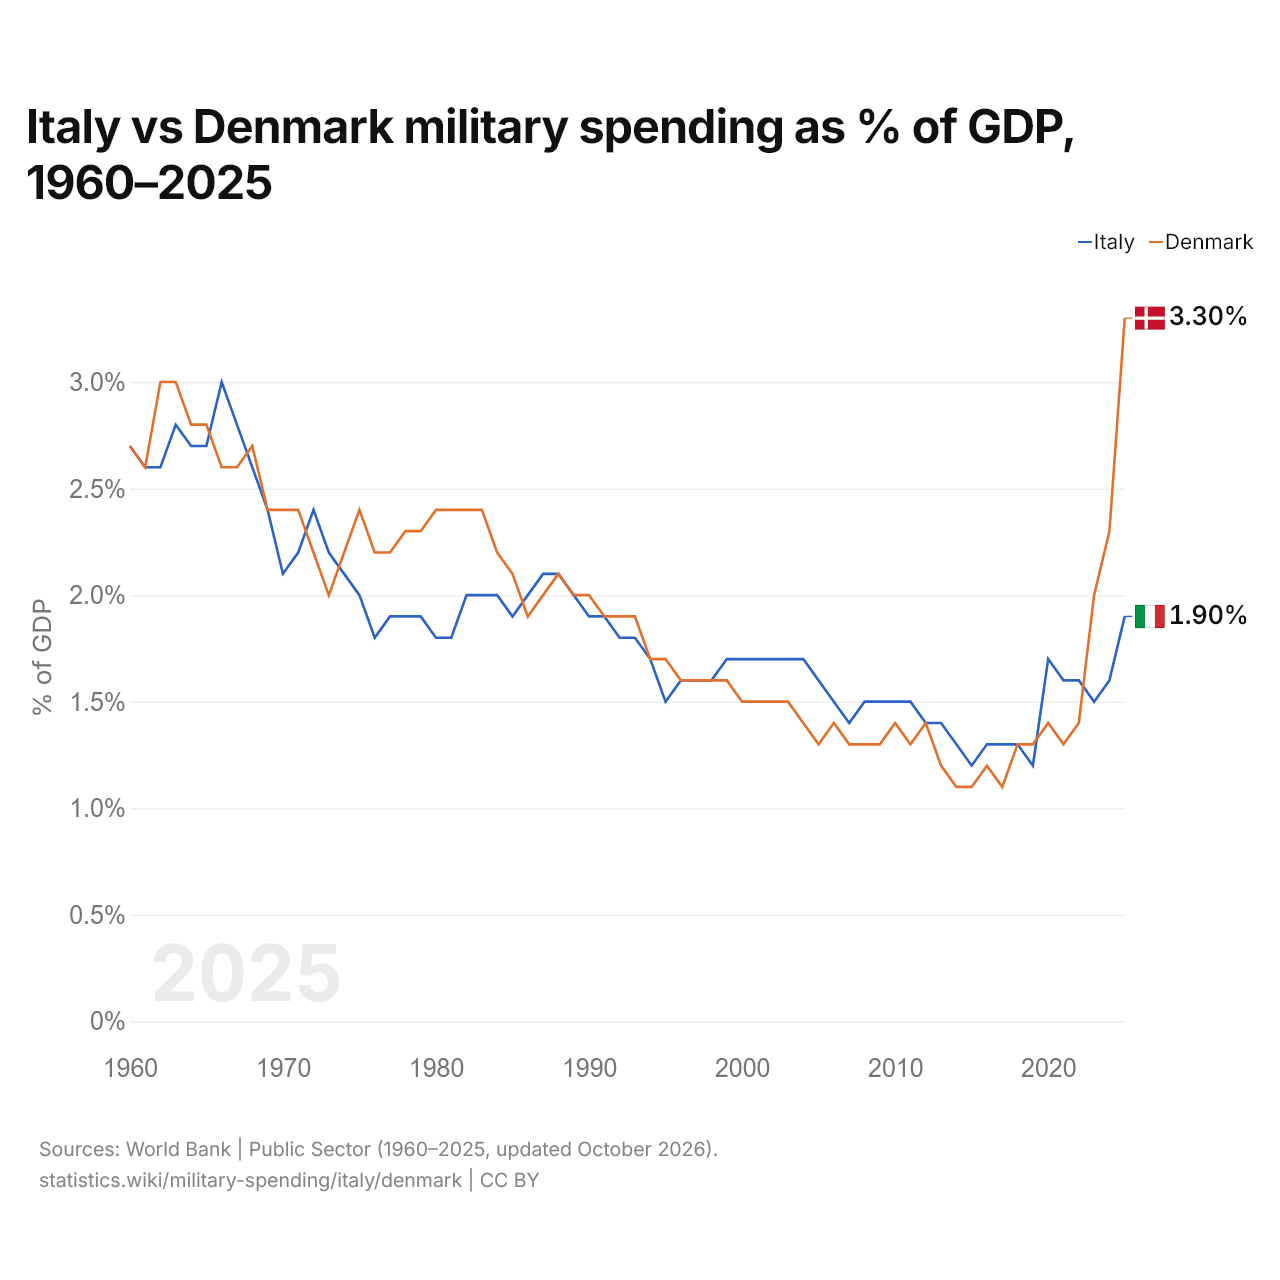
En 2025, les dépenses militaires représentaient 1,9 % du PIB en Italie et 3,3 % au Danemark : 1,4 points de pourcentage de plus au Danemark. En 2015, elles représentaient 1,2 % en Italie et 1,1 % au Danemark, soit 0,1 points de pourcentage de plus en Italie.
Les dépenses militaires du Danemark, en part du PIB, sont supérieures à celles de l'Italie chaque année depuis 2023.
Italie vs Danemark : chiffres des dépenses militaires
|
Italie
|
Danemark
|
|
|---|---|---|
| $ US, 2025 | 48,2 Md $US | 15,0 Md $US |
| % du PIB, 2025 | 1,9 % | 3,3 % |
| Par personne, $ US | 818 $US | 2 504 $US |
| Part mondiale | 1,69 % | 0,53 % |
| Rang mondial | 12/154 | 27/154 |
Comparer les dépenses militaires de 2 pays au choix
Sources :
- Banque mondiale | Secteur public (1960–2025, mis à jour en octobre 2026)
Creative Commons Attribution (CC BY) : vous pouvez copier, partager, adapter et réutiliser ce contenu, y compris à des fins commerciales, à condition de citer statistics.wiki et d’indiquer les modifications apportées. Les sources citées ci-dessus peuvent avoir leurs propres conditions de licence.