
Danemark vs Autriche : dépenses militaires ($ US), 1960–2025
| Année | $ US | |
|---|---|---|
 Danemark |
 Autriche |
|
| 2025 | 15 045 307 962 $ US | 6 377 841 255 $ US |
| 2024 | 9 630 891 141 $ US | 5 297 170 013 $ US |
| 2023 | 8 142 586 607 $ US | 4 455 908 013 $ US |
| 2022 | 5 472 748 572 $ US | 3 617 116 770 $ US |
| 2021 | 5 274 439 884 $ US | 4 196 948 098 $ US |
| 2020 | 4 885 548 211 $ US | 3 847 944 473 $ US |
| 2019 | 4 487 478 756 $ US | 3 336 257 934 $ US |
| 2018 | 4 558 786 678 $ US | 3 389 811 828 $ US |
| 2017 | 3 780 312 393 $ US | 3 159 831 218 $ US |
| 2016 | 3 593 436 189 $ US | 2 888 574 360 $ US |
| 2015 | 3 364 047 774 $ US | 2 666 603 280 $ US |
| 2014 | 4 056 861 511 $ US | 3 309 561 153 $ US |
| 2013 | 4 216 646 319 $ US | 3 229 983 072 $ US |
| 2012 | 4 422 461 491 $ US | 3 187 046 775 $ US |
| 2011 | 4 518 588 835 $ US | 3 414 187 842 $ US |
| 2010 | 4 503 496 131 $ US | 3 221 491 501 $ US |
| 2009 | 4 337 331 418 $ US | 3 348 175 209 $ US |
| 2008 | 4 788 058 296 $ US | 3 761 898 342 $ US |
| 2007 | 4 175 652 589 $ US | 3 504 449 392 $ US |
| 2006 | 3 896 717 562 $ US | 2 642 533 286 $ US |
| 2005 | 3 468 458 704 $ US | 2 687 234 993 $ US |
| 2004 | 3 578 808 566 $ US | 2 684 092 420 $ US |
| 2003 | 3 199 143 859 $ US | 2 387 314 003 $ US |
| 2002 | 2 694 085 906 $ US | 1 890 627 386 $ US |
| 2001 | 2 525 231 893 $ US | 1 790 363 427 $ US |
| 2000 | 2 392 522 671 $ US | 1 930 350 230 $ US |
| 1999 | 2 784 897 222 $ US | 2 121 466 394 $ US |
| 1998 | 2 846 078 080 $ US | 2 209 911 276 $ US |
| 1997 | 2 804 300 098 $ US | 2 215 560 384 $ US |
| 1996 | 3 086 208 978 $ US | 2 476 754 080 $ US |
| 1995 | 3 117 949 450 $ US | 2 576 767 582 $ US |
| 1994 | 2 718 768 670 $ US | 2 218 872 531 $ US |
| 1993 | 2 682 027 792 $ US | 2 115 527 916 $ US |
| 1992 | 2 837 759 481 $ US | 2 135 927 183 $ US |
| 1991 | 2 671 929 962 $ US | 1 998 105 070 $ US |
| 1990 | 2 696 292 300 $ US | 1 982 540 697 $ US |
| 1989 | 2 273 446 184 $ US | 1 636 297 498 $ US |
| 1988 | 2 411 867 529 $ US | 1 725 535 040 $ US |
| 1987 | 2 218 222 740 $ US | 1 752 176 865 $ US |
| 1986 | 1 706 553 505 $ US | 1 488 363 961 $ US |
| 1985 | 1 314 418 685 $ US | 1 045 449 718 $ US |
| 1984 | 1 315 996 832 $ US | 957 654 672 $ US |
| 1983 | 1 426 676 771 $ US | 999 400 283 $ US |
| 1982 | 1 453 974 927 $ US | 1 003 172 741 $ US |
| 1981 | 1 498 802 937 $ US | 976 469 364 $ US |
| 1980 | 1 673 336 248 $ US | 1 160 873 638 $ US |
| 1979 | 1 584 918 352 $ US | 1 055 994 321 $ US |
| 1978 | 1 370 364 571 $ US | 883 385 007 $ US |
| 1977 | 1 101 762 175 $ US | 691 063 674 $ US |
| 1976 | 980 949 933 $ US | 584 191 025 $ US |
| 1975 | 968 943 517 $ US | 579 093 457 $ US |
| 1974 | 762 656 414 $ US | 447 566 076 $ US |
| 1973 | 606 932 156 $ US | 348 384 983 $ US |
| 1972 | 506 422 361 $ US | 264 180 949 $ US |
| 1971 | 450 858 280 $ US | 221 664 193 $ US |
| 1970 | 414 783 353 $ US | 211 336 451 $ US |
| 1969 | 368 663 989 $ US | 204 610 678 $ US |
| 1968 | 361 400 270 $ US | 192 832 244 $ US |
| 1967 | 337 996 142 $ US | 187 219 585 $ US |
| 1966 | 314 610 126 $ US | 177 702 225 $ US |
| 1965 | 307 872 371 $ US | 151 349 235 $ US |
| 1964 | 275 120 243 $ US | 173 889 213 $ US |
| 1963 | 257 496 781 $ US | 132 914 045 $ US |
| 1962 | 240 051 552 $ US | 105 367 535 $ US |
| 1961 | 182 586 510 $ US | 96 191 346 $ US |
| 1960 | 173 588 446 $ US | 96 591 479 $ US |
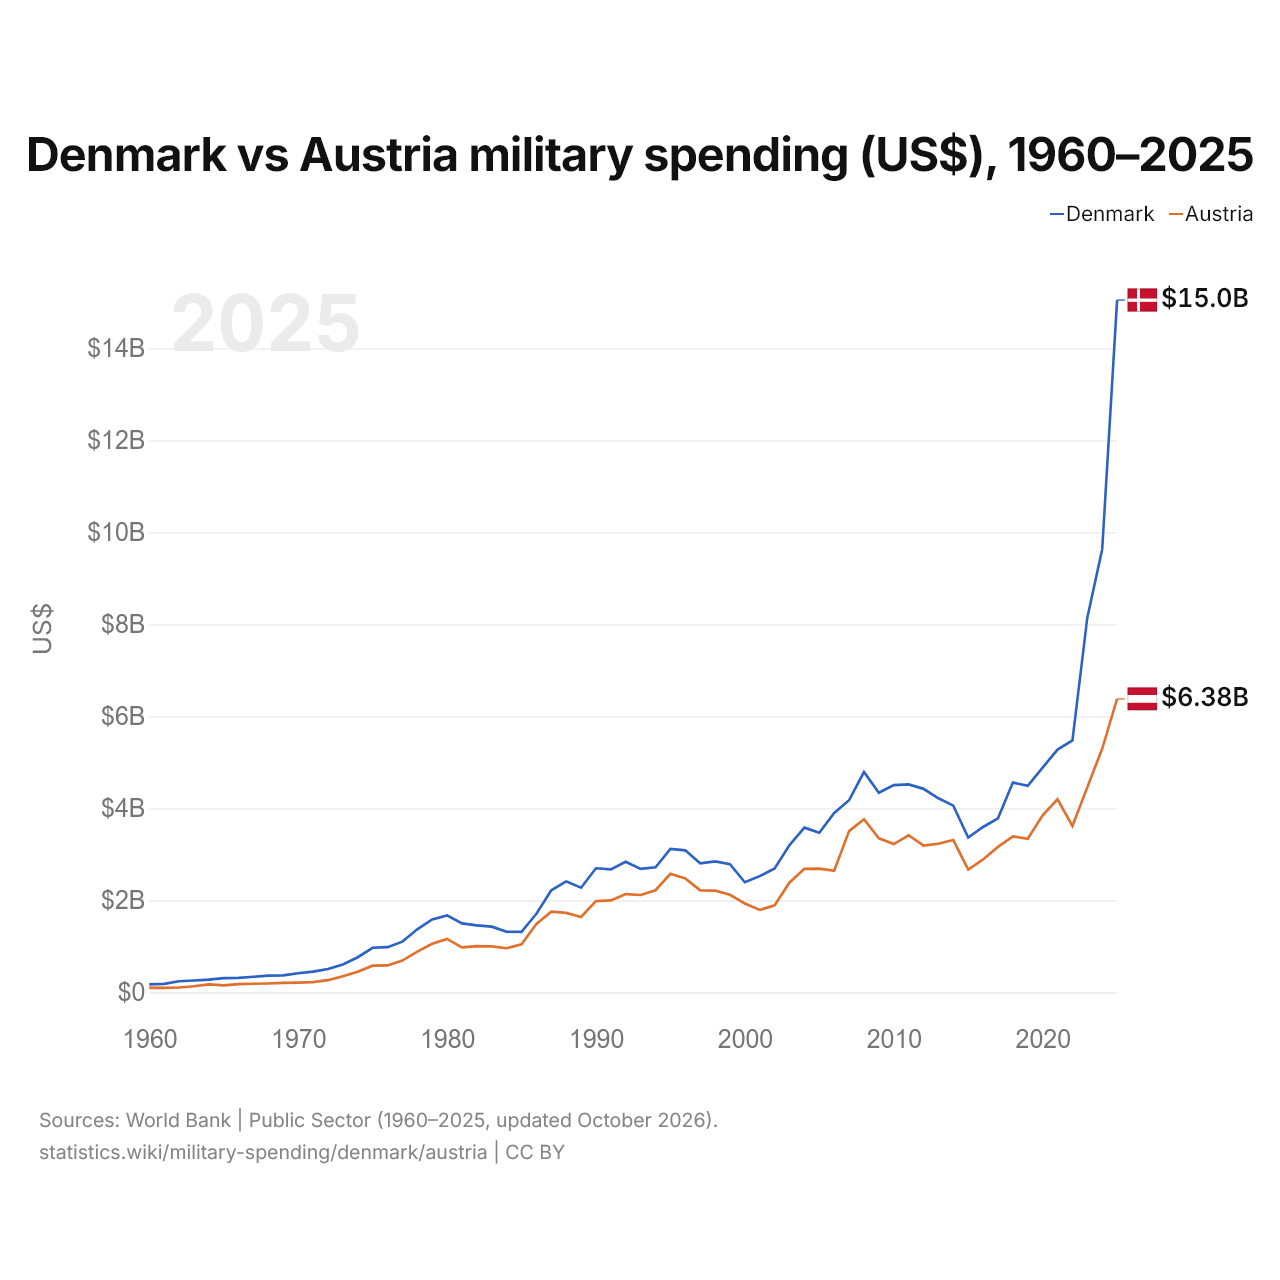
En 2025, les dépenses militaires s'élevaient à 15 milliards de dollars au Danemark et à 6,38 milliards de dollars en Autriche : 2,4 fois plus au Danemark. En 1960, elles s'élevaient à 174 millions de dollars au Danemark et à 96,6 millions de dollars en Autriche, soit 1,8 fois plus au Danemark.
Danemark vs Autriche : dépenses militaires en % du PIB, 1960–2025
| Année | % du PIB | |
|---|---|---|
|
Danemark
|
Autriche
|
|
| 2025 | 3,3 % | 1,1 % |
| 2024 | 2,3 % | 1 % |
| 2023 | 2 % | 0,9 % |
| 2022 | 1,4 % | 0,8 % |
| 2021 | 1,3 % | 0,9 % |
| 2020 | 1,4 % | 0,9 % |
| 2019 | 1,3 % | 0,8 % |
| 2018 | 1,3 % | 0,7 % |
| 2017 | 1,1 % | 0,8 % |
| 2016 | 1,2 % | 0,7 % |
| 2015 | 1,1 % | 0,7 % |
| 2014 | 1,1 % | 0,8 % |
| 2013 | 1,2 % | 0,8 % |
| 2012 | 1,4 % | 0,8 % |
| 2011 | 1,3 % | 0,8 % |
| 2010 | 1,4 % | 0,8 % |
| 2009 | 1,3 % | 0,8 % |
| 2008 | 1,3 % | 0,9 % |
| 2007 | 1,3 % | 0,9 % |
| 2006 | 1,4 % | 0,8 % |
| 2005 | 1,3 % | 0,9 % |
| 2004 | 1,4 % | 0,9 % |
| 2003 | 1,5 % | 0,9 % |
| 2002 | 1,5 % | 0,9 % |
| 2001 | 1,5 % | 0,9 % |
| 2000 | 1,5 % | 1 % |
| 1999 | 1,6 % | 1 % |
| 1998 | 1,6 % | 1 % |
| 1997 | 1,6 % | 1 % |
| 1996 | 1,6 % | 1 % |
| 1995 | 1,7 % | 1,1 % |
| 1994 | 1,7 % | 1,1 % |
| 1993 | 1,9 % | 1,1 % |
| 1992 | 1,9 % | 1,1 % |
| 1991 | 1,9 % | 1,2 % |
| 1990 | 2 % | 1,2 % |
| 1989 | 2 % | 1,2 % |
| 1988 | 2,1 % | 1,3 % |
| 1987 | 2 % | 1,4 % |
| 1986 | 1,9 % | 1,5 % |
| 1985 | 2,1 % | 1,5 % |
| 1984 | 2,2 % | 1,4 % |
| 1983 | 2,4 % | 1,4 % |
| 1982 | 2,4 % | 1,4 % |
| 1981 | 2,4 % | 1,4 % |
| 1980 | 2,4 % | 1,4 % |
| 1979 | 2,3 % | 1,4 % |
| 1978 | 2,3 % | 1,4 % |
| 1977 | 2,2 % | 1,3 % |
| 1976 | 2,2 % | 1,4 % |
| 1975 | 2,4 % | 1,5 % |
| 1974 | 2,2 % | 1,3 % |
| 1973 | 2 % | 1,2 % |
| 1972 | 2,2 % | 1,2 % |
| 1971 | 2,4 % | 1,2 % |
| 1970 | 2,4 % | 1,4 % |
| 1969 | 2,4 % | 1,5 % |
| 1968 | 2,7 % | 1,5 % |
| 1967 | 2,6 % | 1,6 % |
| 1966 | 2,6 % | 1,6 % |
| 1965 | 2,8 % | 1,5 % |
| 1964 | 2,8 % | 1,9 % |
| 1963 | 3 % | 1,6 % |
| 1962 | 3 % | 1,4 % |
| 1961 | 2,6 % | 1,3 % |
| 1960 | 2,7 % | 1,5 % |
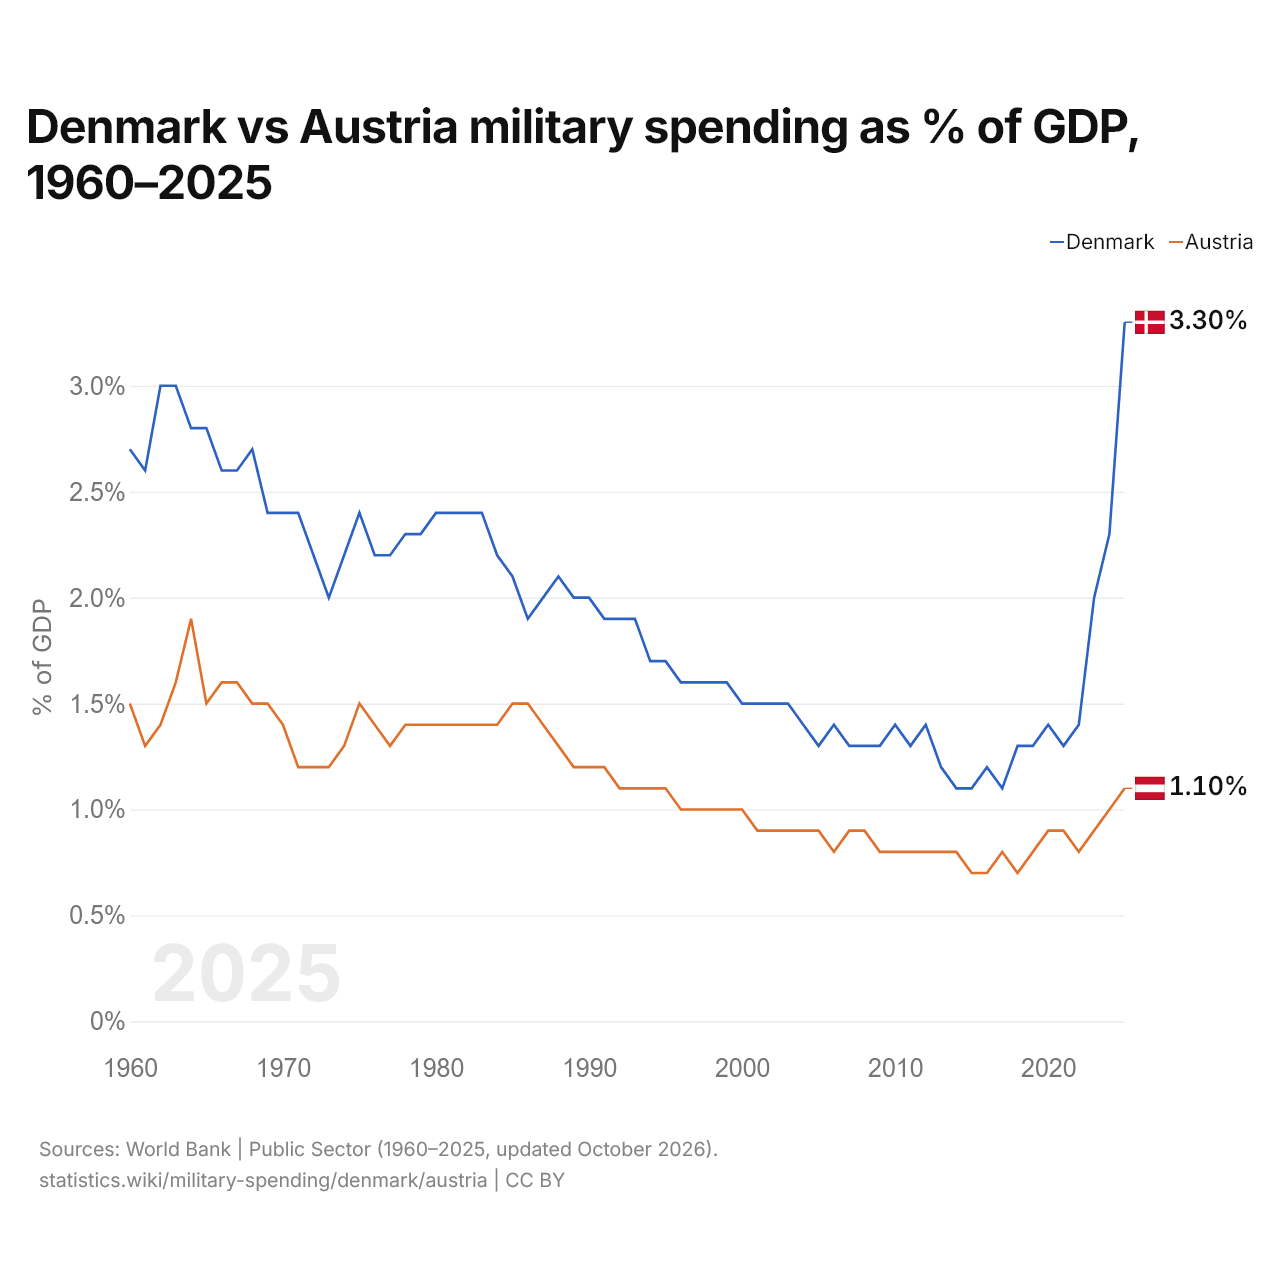
En 2025, les dépenses militaires représentaient 3,3 % du PIB au Danemark et 1,1 % en Autriche : 2,2 points de pourcentage de plus au Danemark. En 2015, elles représentaient 1,1 % au Danemark et 0,7 % en Autriche, soit 0,4 points de pourcentage de plus au Danemark.
Les dépenses militaires du Danemark, en part du PIB, sont supérieures à celles de l'Autriche chaque année depuis 1960.
Danemark vs Autriche : chiffres des dépenses militaires
|
Danemark
|
Autriche
|
|
|---|---|---|
| $ US, 2025 | 15,0 Md $US | 6,38 Md $US |
| % du PIB, 2025 | 3,3 % | 1,1 % |
| Par personne, $ US | 2 504 $US | 693 $US |
| Part mondiale | 0,53 % | 0,22 % |
| Rang mondial | 27/154 | 41/154 |
Comparer les dépenses militaires de 2 pays au choix
Sources :
- Banque mondiale | Secteur public (1960–2025, mis à jour en octobre 2026)
Creative Commons Attribution (CC BY) : vous pouvez copier, partager, adapter et réutiliser ce contenu, y compris à des fins commerciales, à condition de citer statistics.wiki et d’indiquer les modifications apportées. Les sources citées ci-dessus peuvent avoir leurs propres conditions de licence.